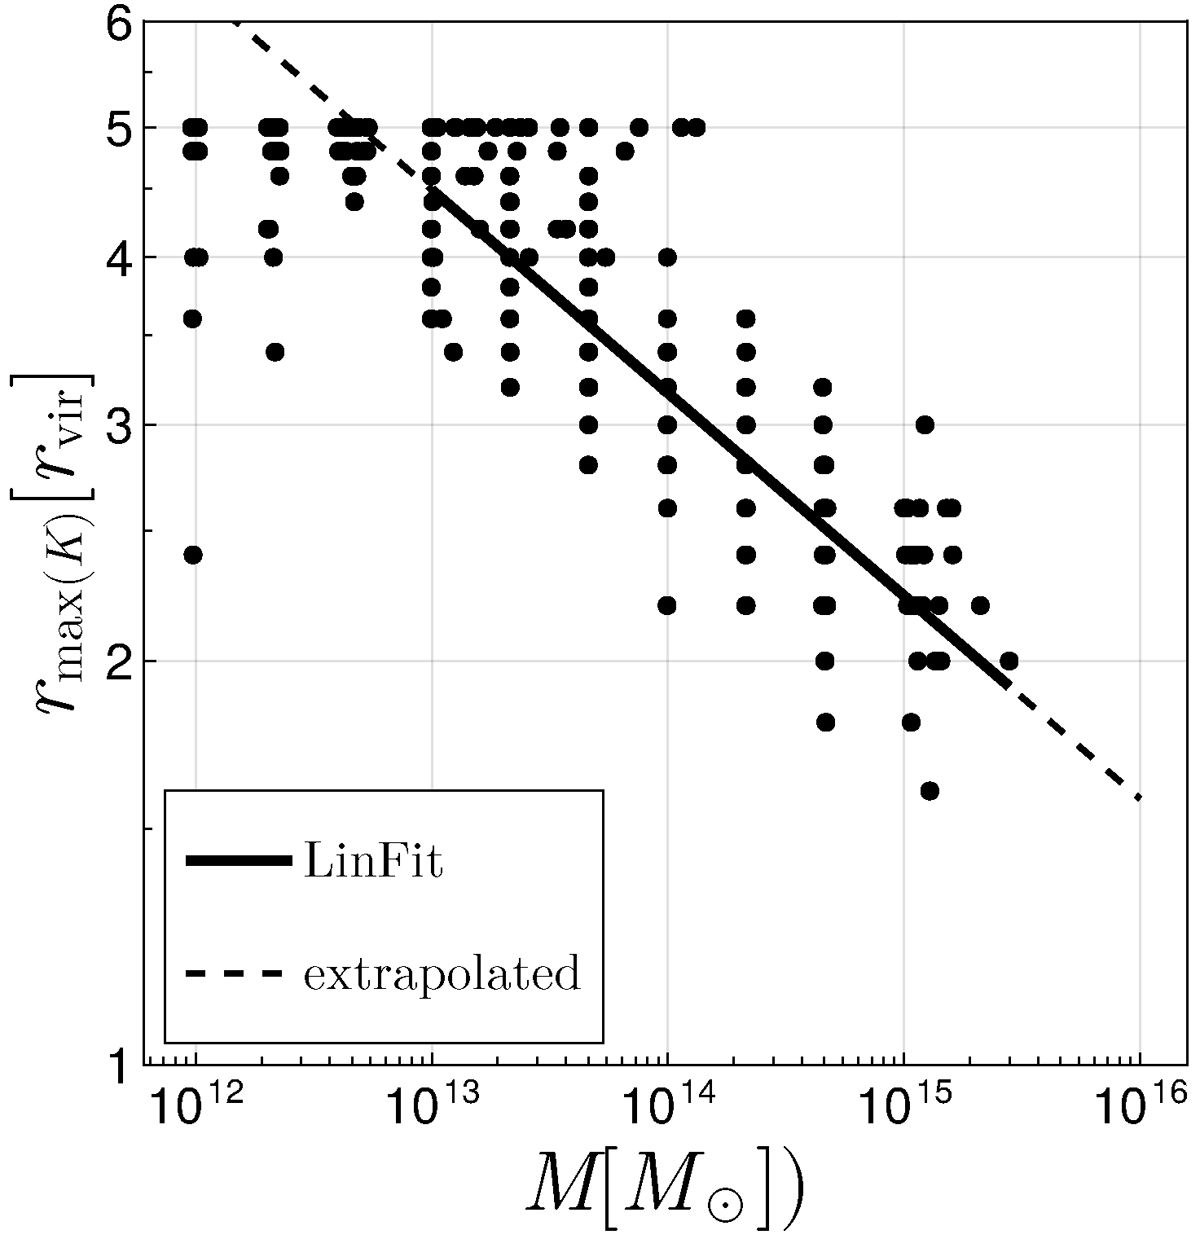
Fig. 9.
Download original image
Mass dependence of the radius of maximal entropy. The dots represent the individual haloes of the sample. The line shows a Linear fit in log-log space obtained from the haloes in the range where there is a clear entropy peak visible. The obtained parameters are t = 2.6193 ± 0.1157 and m = −0.1513 ± 0.0008 using a log(rmax(K)) = m × log(M/M⊙)+t model. The tight spacing of the dots along the x-axis reflects the mass spread of the Fig. 3, which we have optimised to be as small as possible (see Sec:Methods).
Current usage metrics show cumulative count of Article Views (full-text article views including HTML views, PDF and ePub downloads, according to the available data) and Abstracts Views on Vision4Press platform.
Data correspond to usage on the plateform after 2015. The current usage metrics is available 48-96 hours after online publication and is updated daily on week days.
Initial download of the metrics may take a while.