Fig. A.4.
Download original image
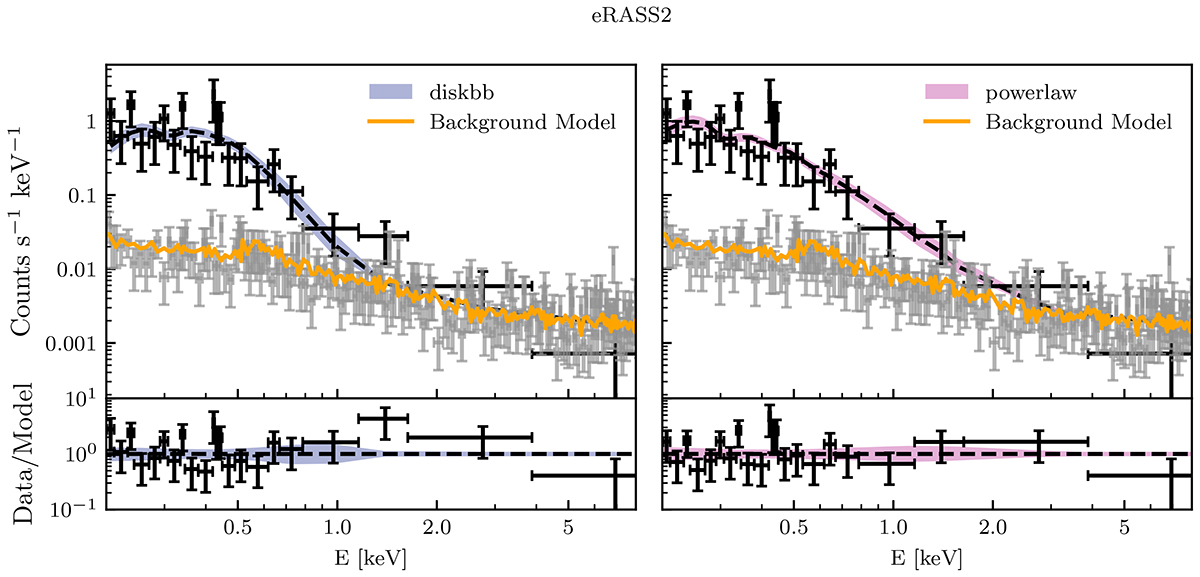
X-ray spectra of J012026. The observation name is reported in the title. All panels show, respectively with black and gray markers, the source and background counts, which have been re-binned for visualization purposes. The left panels show the DISKBB fit (dashed black line) with 1σ uncertainties (blue band), while the right panels show the same results for the power-law model (black dashed line and pink band). In all panels, the orange line shows the background model.
Current usage metrics show cumulative count of Article Views (full-text article views including HTML views, PDF and ePub downloads, according to the available data) and Abstracts Views on Vision4Press platform.
Data correspond to usage on the plateform after 2015. The current usage metrics is available 48-96 hours after online publication and is updated daily on week days.
Initial download of the metrics may take a while.