Fig. 2.
Download original image
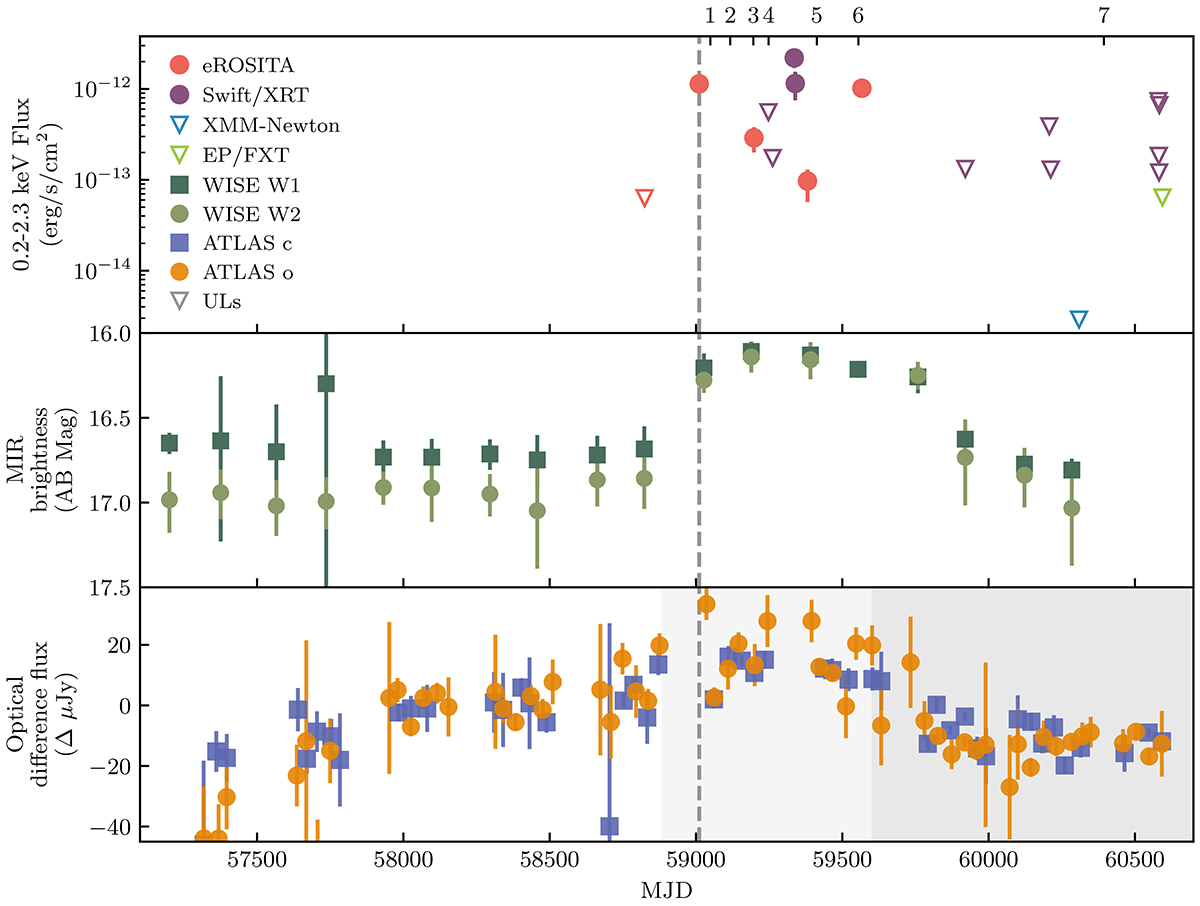
Multiwavelength light curve of J012026. Top panel: X-ray evolution in the 0.2–2.3 keV band (empty triangles correspond to upper limits). Middle panel: WISE W1 and W2 light curve presented in AB magnitudes. Bottom panel: Difference-photometry light curve for the ATLAS o and c filters in μJy. The vertical dashed lines indicate the eRASS2 discovery. The numbered ticks at the top of the plot indicate the epochs at which optical spectroscopy was collected (see Sect. 5).
Current usage metrics show cumulative count of Article Views (full-text article views including HTML views, PDF and ePub downloads, according to the available data) and Abstracts Views on Vision4Press platform.
Data correspond to usage on the plateform after 2015. The current usage metrics is available 48-96 hours after online publication and is updated daily on week days.
Initial download of the metrics may take a while.