Open Access
Fig. C.2.
Download original image
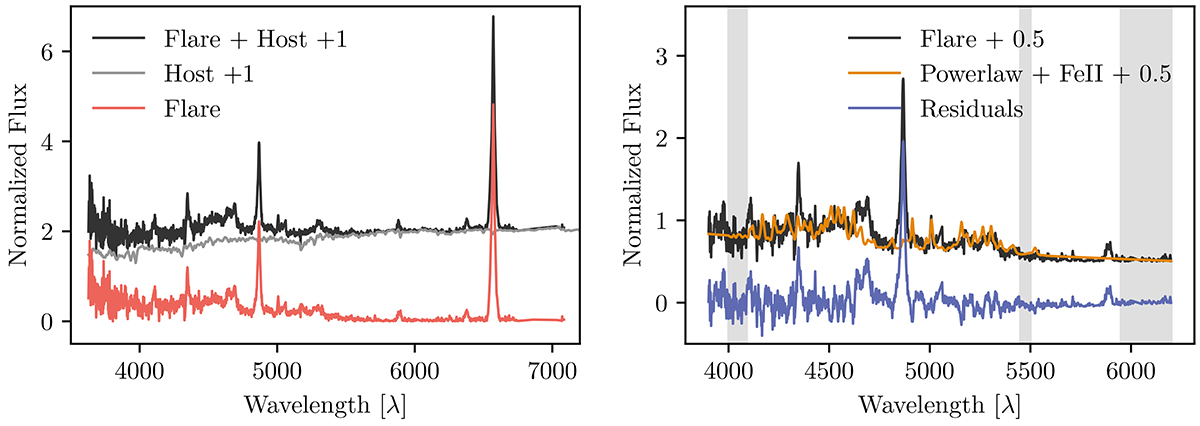
Left: Example of the host subtraction procedure on spectrum 3. Right: Example of the power-law and Fe II fitting and subtraction procedure on the red residuals of the left panel. The gray-shaded regions indicate where the power law is fit.
Current usage metrics show cumulative count of Article Views (full-text article views including HTML views, PDF and ePub downloads, according to the available data) and Abstracts Views on Vision4Press platform.
Data correspond to usage on the plateform after 2015. The current usage metrics is available 48-96 hours after online publication and is updated daily on week days.
Initial download of the metrics may take a while.