Fig. C.3.
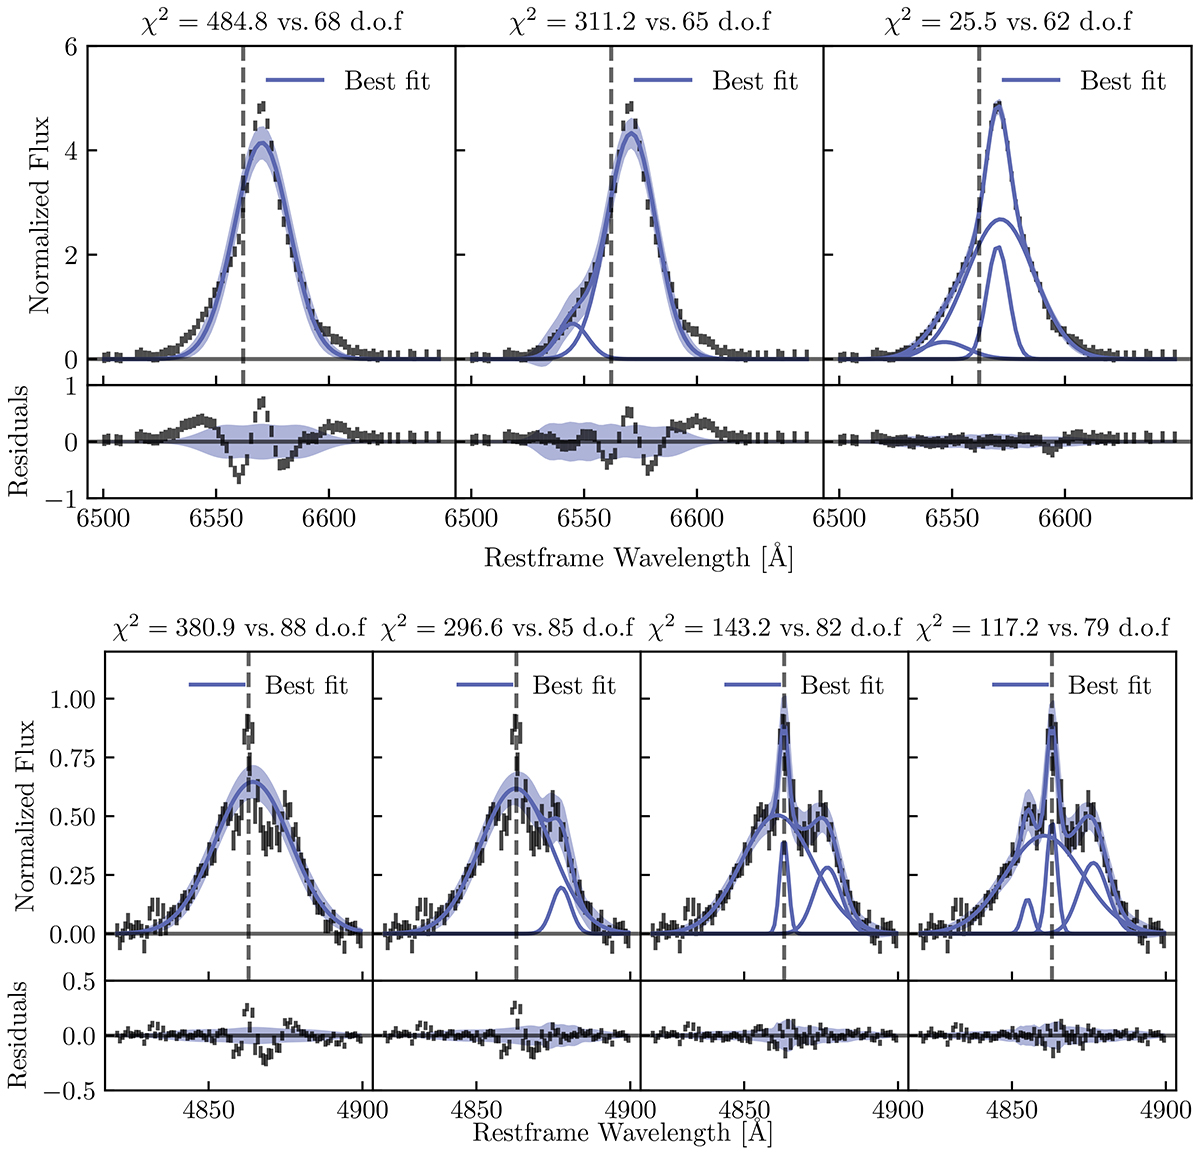
Download original image
Emission line fitting procedure examples. Top: Example on the Hα line in spectrum 3. The three panels show, respectively, the best fit model obtained with one, two, or three Gaussians, and their respective residuals. The spectrum is represented by the black markers while the blue lines show the individual Gaussian components. The semitransparent band shows the 3σ uncertainty of the total model. The vertical dashed line indicates the rest-frame centroid of Hα. Bottom: Example on the triple-peaked Hβ line in spectrum 5. The vertical dashed line indicates the rest-frame Hβ centroid.
Current usage metrics show cumulative count of Article Views (full-text article views including HTML views, PDF and ePub downloads, according to the available data) and Abstracts Views on Vision4Press platform.
Data correspond to usage on the plateform after 2015. The current usage metrics is available 48-96 hours after online publication and is updated daily on week days.
Initial download of the metrics may take a while.