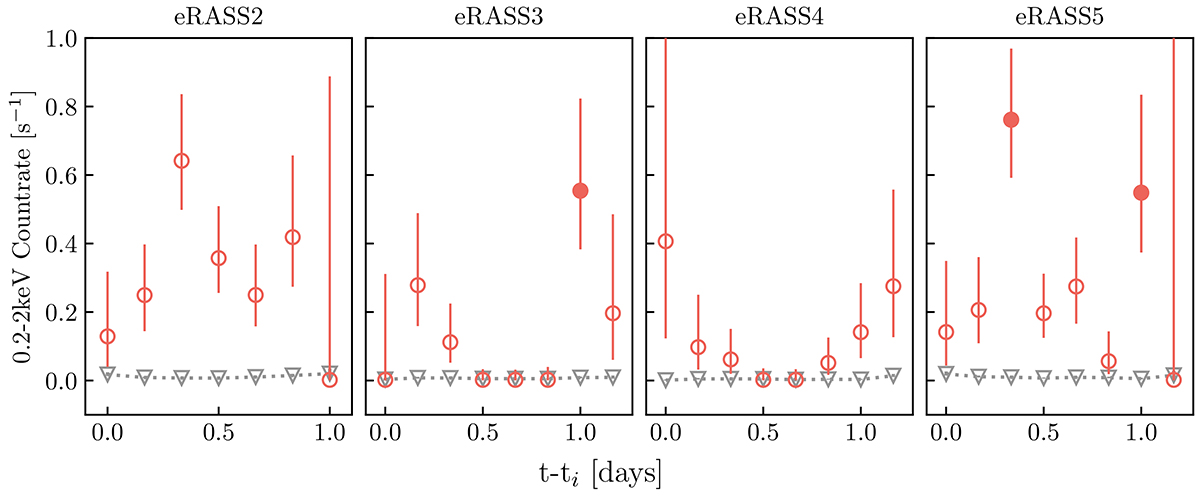
Fig. 3.
Download original image
eROSITA eROday 0.2–2.0 keV band light curve of J012026. The empty red circles show the source vignetting and exposure corrected count rates, while the gray triangles correspond to the background count rate. The filled red circles correspond to the eROdays selected as flaring. The time (x) axis is in units of days since the first observation of the source, for each scan.
Current usage metrics show cumulative count of Article Views (full-text article views including HTML views, PDF and ePub downloads, according to the available data) and Abstracts Views on Vision4Press platform.
Data correspond to usage on the plateform after 2015. The current usage metrics is available 48-96 hours after online publication and is updated daily on week days.
Initial download of the metrics may take a while.