Fig. 5.
Download original image
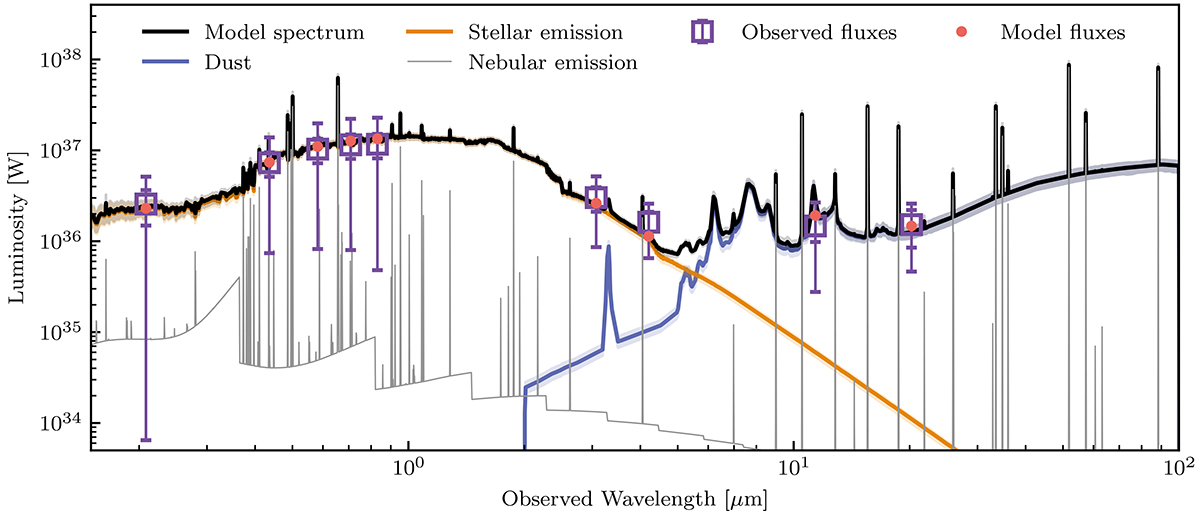
Observed and modeled SED of J012026. The purple squares represent, respectively, the GALEX, DECam g, r, i, z, and W1 − W4 observed fluxes, while the red dots represent the model-predicted fluxes. The orange, gray, and blue lines represent the best-fit individual model components, which are respectively stellar, nebular, and dust emission. The black line is the total best-fit model.
Current usage metrics show cumulative count of Article Views (full-text article views including HTML views, PDF and ePub downloads, according to the available data) and Abstracts Views on Vision4Press platform.
Data correspond to usage on the plateform after 2015. The current usage metrics is available 48-96 hours after online publication and is updated daily on week days.
Initial download of the metrics may take a while.