Open Access
Fig. 6.
Download original image
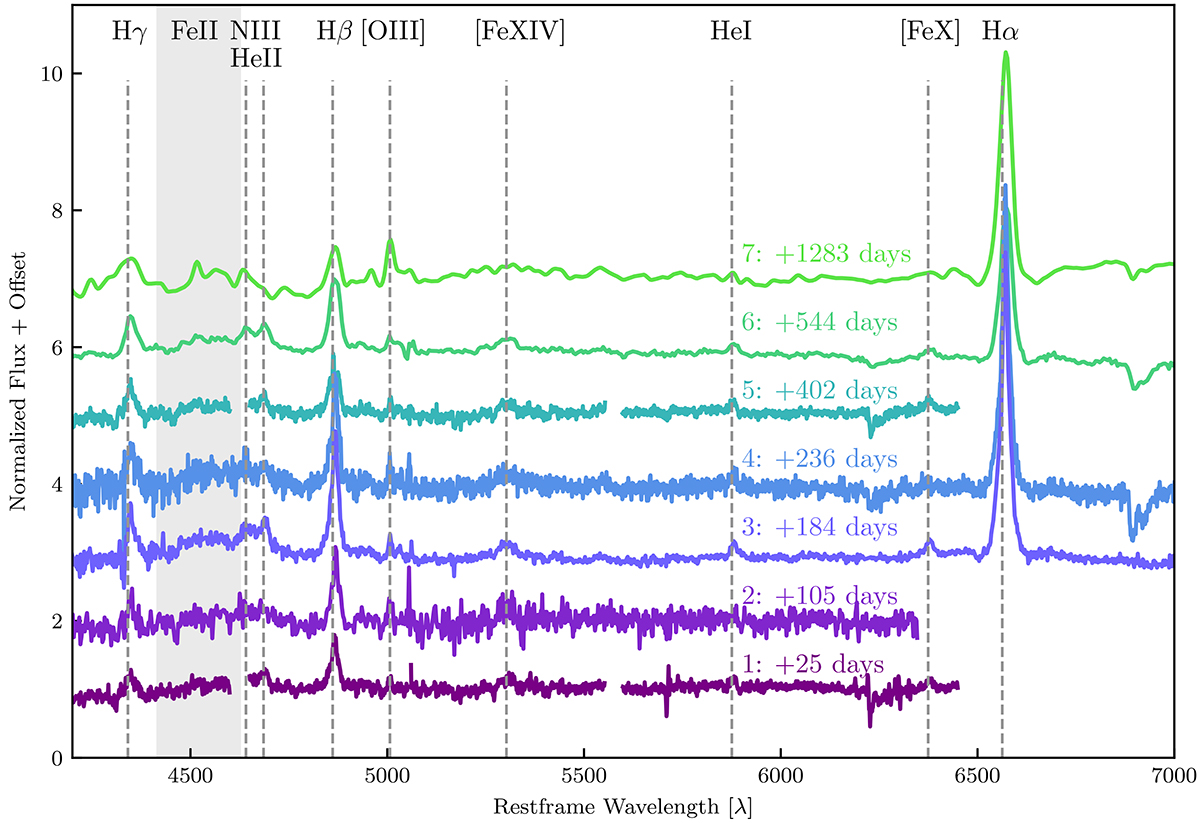
Normalized rest-frame follow-up spectra of J012026, offset by an arbitrary factor for visualization purposes. The most significant emission lines are indicated with dashed lines, and the gray-shaded area shows the prominent Fe II complex. Above each spectrum, we report the ID and phase since the eRASS2 discovery in days.
Current usage metrics show cumulative count of Article Views (full-text article views including HTML views, PDF and ePub downloads, according to the available data) and Abstracts Views on Vision4Press platform.
Data correspond to usage on the plateform after 2015. The current usage metrics is available 48-96 hours after online publication and is updated daily on week days.
Initial download of the metrics may take a while.