Open Access
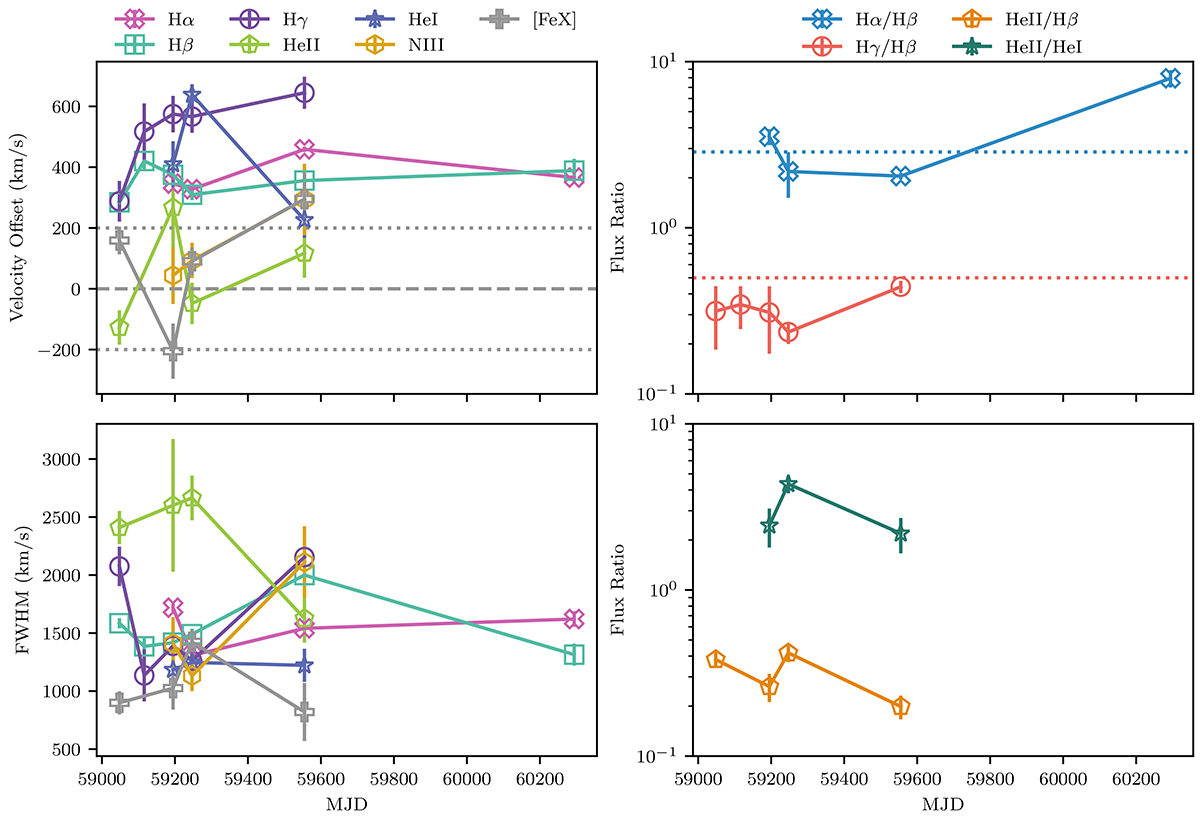
Fig. 7.
Download original image
Line parameter evolution of J012026. In the top-left panel, we plot the limit on the velocity resolution of the follow-up spectra with dotted lines. In the top-right panel, we plot the theoretical values of an unobscured system of the corresponding color ratios with dotted lines.
Current usage metrics show cumulative count of Article Views (full-text article views including HTML views, PDF and ePub downloads, according to the available data) and Abstracts Views on Vision4Press platform.
Data correspond to usage on the plateform after 2015. The current usage metrics is available 48-96 hours after online publication and is updated daily on week days.
Initial download of the metrics may take a while.