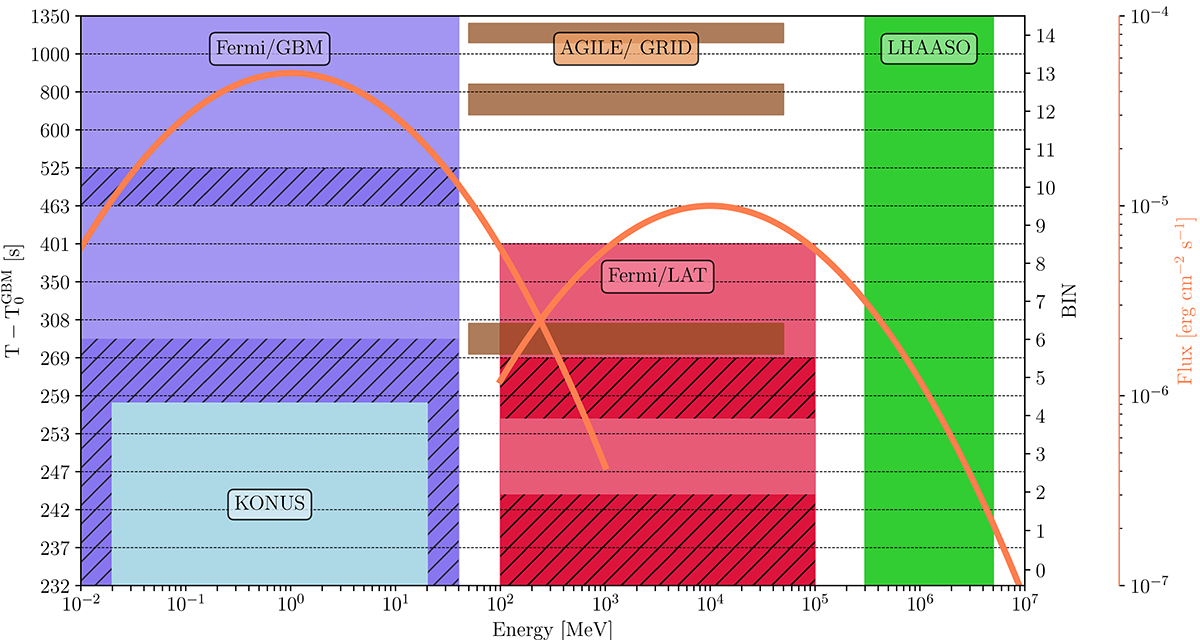
Fig. 1.
Download original image
Illustration of the data availability in each time bin (time stamps indicated in the vertical axis on the left and numbered bins on the right) for each instrument (see Table 2). Areas marked with slashes indicate bins impacted by pile-up in both Fermi/GBM and Fermi/LAT. A simple double-hump spectrum is shown to indicate the preliminary peak positions of the two components seen in GRB 221009A. The selection of time bins is based on the presence of multiwavelength data spanning kilo-electronvolt to tera-electronvolt energies. Six bins (BIN-2, −6, −7, −8, −12, and −14) were chosen for time-resolved spectral analysis.
Current usage metrics show cumulative count of Article Views (full-text article views including HTML views, PDF and ePub downloads, according to the available data) and Abstracts Views on Vision4Press platform.
Data correspond to usage on the plateform after 2015. The current usage metrics is available 48-96 hours after online publication and is updated daily on week days.
Initial download of the metrics may take a while.