Fig. 11.
Download original image
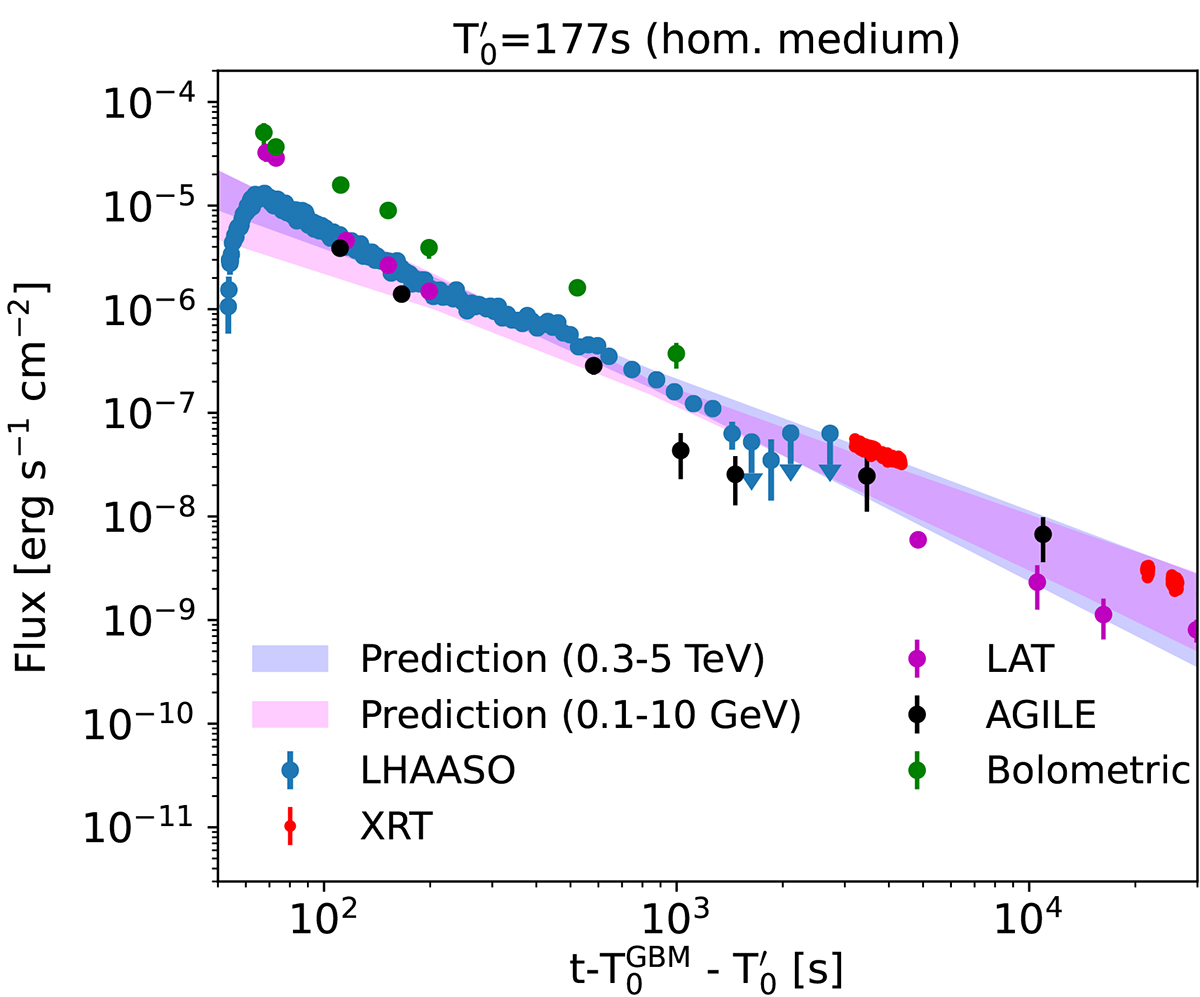
Light curve of LHAASO (0.3–5 TeV; blue points) together with the expected light curve of the afterglow emission (light blue and purple band for tera-electronvolt and giga-electronvolt energies, respectively) in a homogeneous circumburst medium. The model was obtained using the median value of the microphysical parameters of the SSC model for the epoch at 600–800 s (BIN-12), with the self-similar dynamics of the relativistic blast wave. The bands are the predictions of the afterglow radiation at earlier and later epochs derived by the scaling of microphysical parameters according to the expected dynamics of the forward shock (see text for details). The green points represent the bolometric flux in the energy band 10 MeV–5 TeV derived from the analytical log-parabola modeling of the giga-electronvolt–tera-electronvolt hump (see Figure 8 for details).
Current usage metrics show cumulative count of Article Views (full-text article views including HTML views, PDF and ePub downloads, according to the available data) and Abstracts Views on Vision4Press platform.
Data correspond to usage on the plateform after 2015. The current usage metrics is available 48-96 hours after online publication and is updated daily on week days.
Initial download of the metrics may take a while.