Fig. 5.
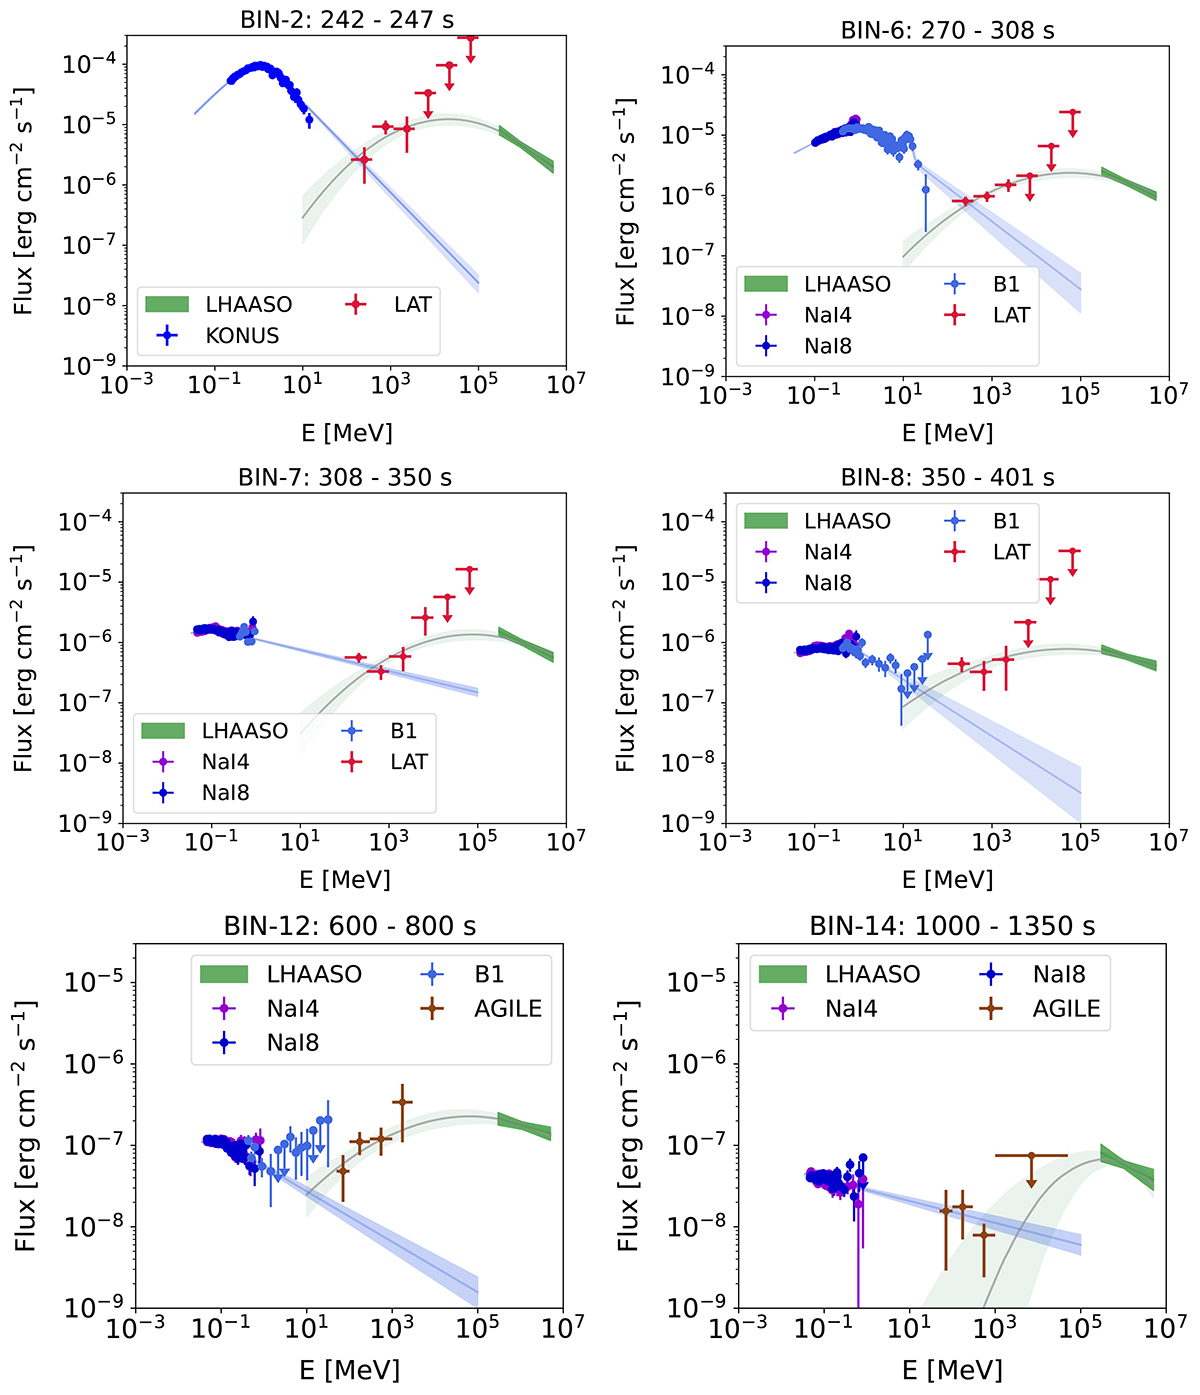
Download original image
Spectra obtained with the available observations (starting from GBM trigger time) from different instruments in six selected time bins on the basis of the presence of giga-electronvolt detections by Fermi/LAT and/or AGILE complemented with intrinsic spectra from LHAASO. Additional data from GBM (NaI4, NaI8, B1) and KONUS in these bins are shown, where available. Overall, the data show the existence of two separate components. The blue band, which spans energies from 10 keV to 100 GeV, represents the 65% confinement of the allowed flux around the best-fit model (marked with a solid blue line; see Table A.1). The green band, covering 10 MeV to 10 TeV, indicates the 65% confinement of the best-fit log-parabola model (best-fit model marked with a solid dark green line) for giga-electronvolt–tera-electronvolt energies.
Current usage metrics show cumulative count of Article Views (full-text article views including HTML views, PDF and ePub downloads, according to the available data) and Abstracts Views on Vision4Press platform.
Data correspond to usage on the plateform after 2015. The current usage metrics is available 48-96 hours after online publication and is updated daily on week days.
Initial download of the metrics may take a while.