Fig. 6.
Download original image
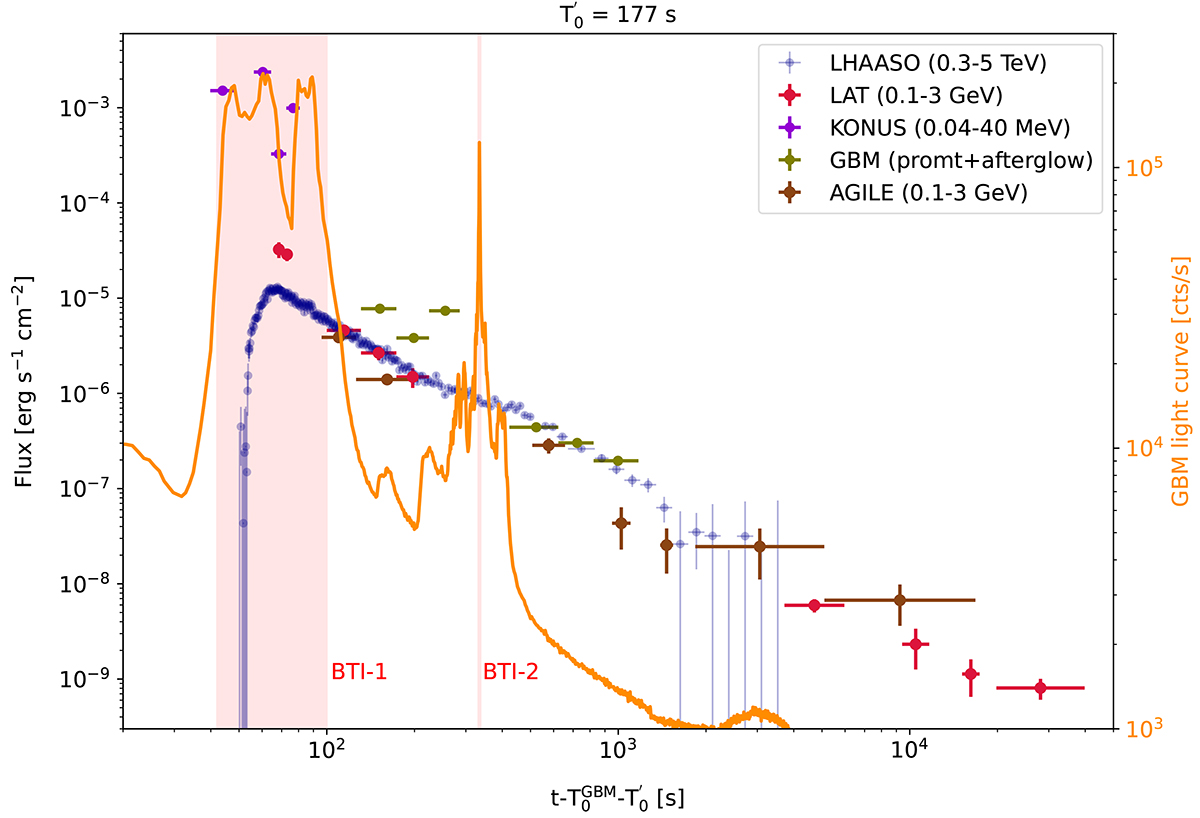
Light curve of GRB 221009A observed with several instruments including LHAASO in the 0.3–5 TeV, Fermi/LAT and AGILE in the 0.1–3 GeV, and GBM and KONUS in the 0.04–40 MeV range. The two phases (BTI-1 and BTI-2) marked with a shaded red region denote the BTI intervals of Fermi/GBM. The orange line indicates the background-subtracted GBM light curve in counts/s. The magenta points are indicative of the KONUS flux in the prompt emission phase during BTI-1. The dark green data points are the flux points from GBM indicated as “prompt+afterglow” as during the period after BTI-1 the emission is a combination of prompt and afterglow. The details of the analysis of the Fermi/LAT data are discussed in Sect. 2. The AGILE data, obtained from Tavani et al. (2023), have been rescaled in the energy band 0.1–3 GeV. The light curve was plotted with the choice of a trigger time of T![]() = 177 s after the GBM trigger time (T
= 177 s after the GBM trigger time (T![]() ) that marks the arrival of the first mega-electronvolt pulse, reported by Frederiks et al. (2023). The light curves in the energy bands mentioned above tend to show a similar temporal decay (with a similar energy flux) after (about) 450 s, which translates to about 630 s from the GBM trigger time. This time represents the onset of the afterglow emission. The time intervals over which the spectrum is constructed are indicated in Table 2.
) that marks the arrival of the first mega-electronvolt pulse, reported by Frederiks et al. (2023). The light curves in the energy bands mentioned above tend to show a similar temporal decay (with a similar energy flux) after (about) 450 s, which translates to about 630 s from the GBM trigger time. This time represents the onset of the afterglow emission. The time intervals over which the spectrum is constructed are indicated in Table 2.
Current usage metrics show cumulative count of Article Views (full-text article views including HTML views, PDF and ePub downloads, according to the available data) and Abstracts Views on Vision4Press platform.
Data correspond to usage on the plateform after 2015. The current usage metrics is available 48-96 hours after online publication and is updated daily on week days.
Initial download of the metrics may take a while.