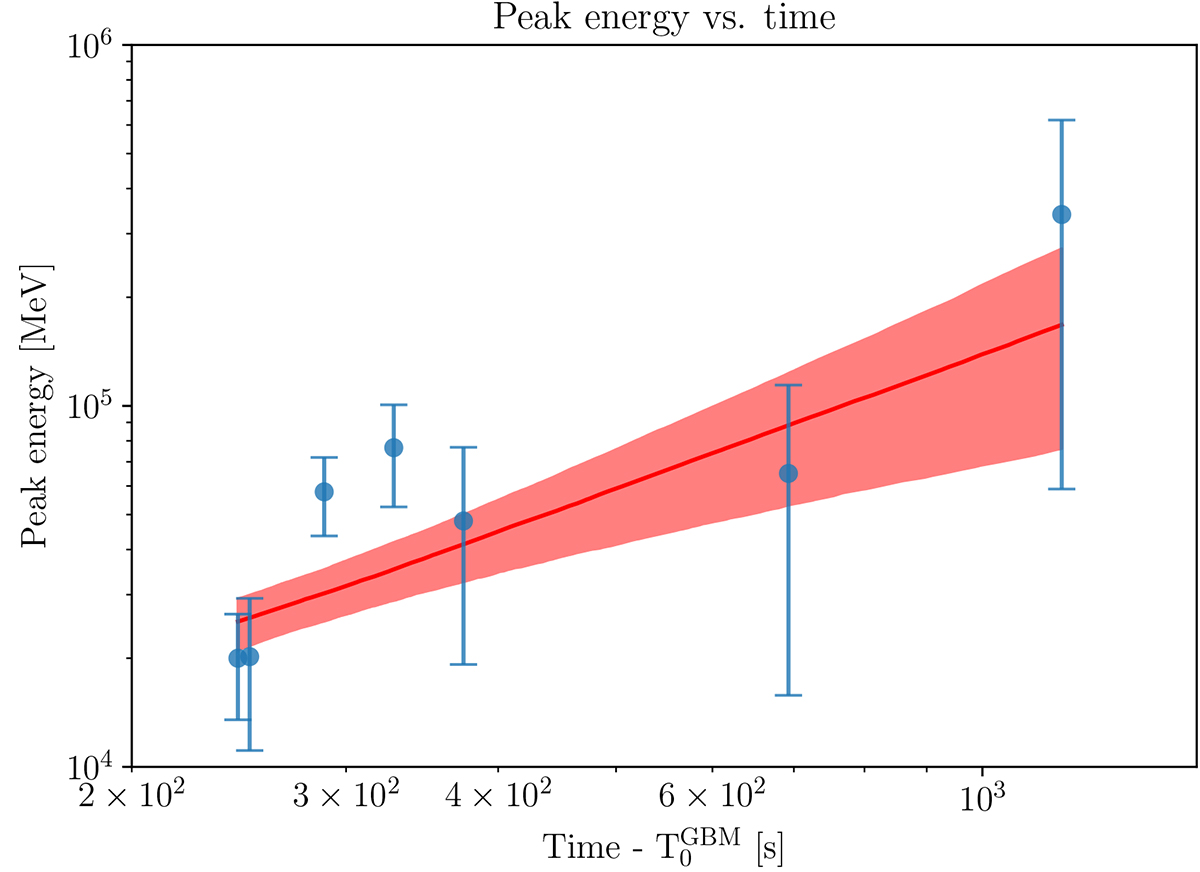
Fig. 7.
Download original image
Variation in peak energy of the second spectral component (SSC component) as a function of time starting from 240 s after the trigger time of GBM until about 1500 s. No significant variation in the peak-energy has been observed mainly due to the larger uncertainty. The red band represents the 1-sigma confidence interval of the best-fit linear (pol-1) model.
Current usage metrics show cumulative count of Article Views (full-text article views including HTML views, PDF and ePub downloads, according to the available data) and Abstracts Views on Vision4Press platform.
Data correspond to usage on the plateform after 2015. The current usage metrics is available 48-96 hours after online publication and is updated daily on week days.
Initial download of the metrics may take a while.