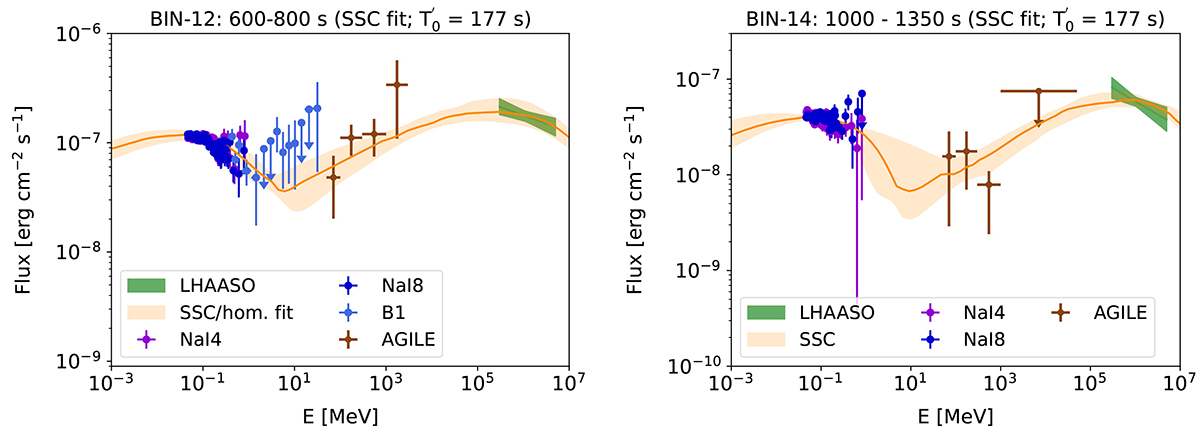
Fig. 9.
Download original image
Spectral energy distribution (SED) of GRB 221009A at the epochs with available LHAASO data: 600–800 s (BIN-12; top panel) and 1000–1350 s (BIN-14; bottom panel). Since these two SEDs are right after prompt emission, in the early afterglow phase, they are individually modeled in a SSC scenario. The shaded yellow area represents the 1σ confidence intervals of the best-fit model. Figures B.1 and B.2 display the posterior parameter distributions for these two epochs. Table 4 and Table 5 enlist the best-fit model parameters and their associated uncertainties, respectively.
Current usage metrics show cumulative count of Article Views (full-text article views including HTML views, PDF and ePub downloads, according to the available data) and Abstracts Views on Vision4Press platform.
Data correspond to usage on the plateform after 2015. The current usage metrics is available 48-96 hours after online publication and is updated daily on week days.
Initial download of the metrics may take a while.