Fig. 5
Download original image
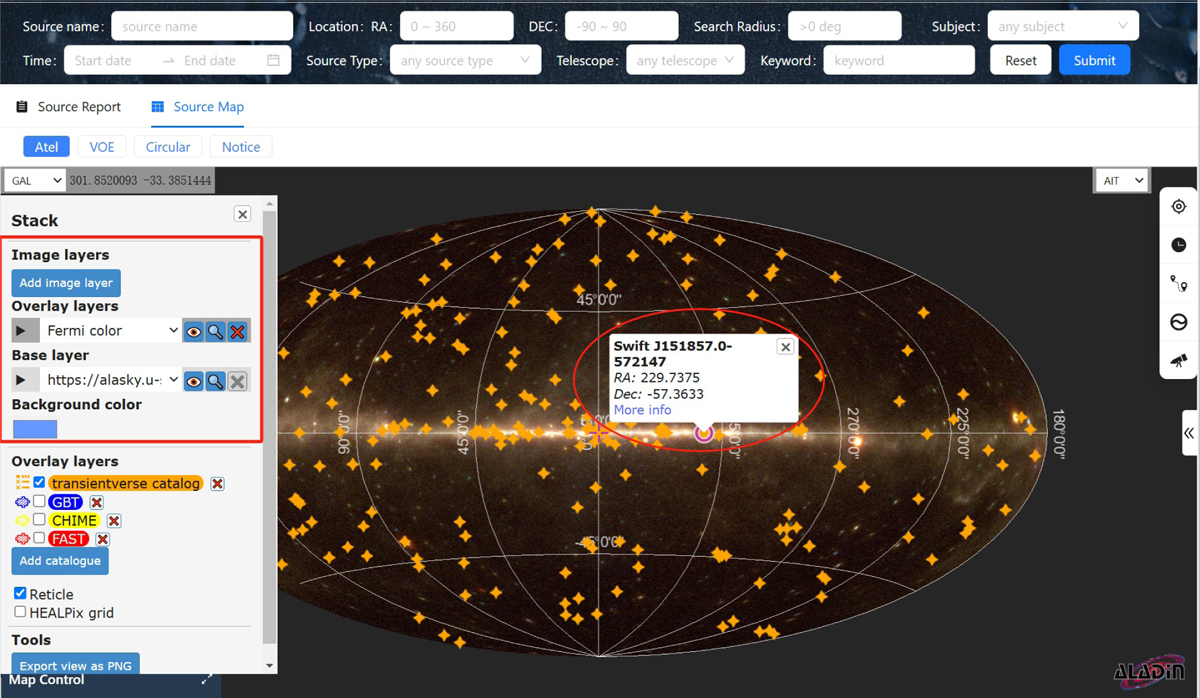
Interactive sky map with multiwavelength overlays: This image shows an interactive sky map with multiwavelength layers, including a Fermi color layer (highlighted in red). The map allows users to overlay multiple wavelength bands and visualize celestial sources, with an elliptical red frame marking a source that can be clicked for detailed information (such as basic data, historical alerts, and related papers from ADS). In the upper left corner, users can select different coordinate systems; the lower left corner displays the visible sky regions of different telescopes; and the upper right corner offers different projection modes.
Current usage metrics show cumulative count of Article Views (full-text article views including HTML views, PDF and ePub downloads, according to the available data) and Abstracts Views on Vision4Press platform.
Data correspond to usage on the plateform after 2015. The current usage metrics is available 48-96 hours after online publication and is updated daily on week days.
Initial download of the metrics may take a while.