| Issue |
A&A
Volume 701, September 2025
|
|
|---|---|---|
| Article Number | A207 | |
| Number of page(s) | 13 | |
| Section | Numerical methods and codes | |
| DOI | https://doi.org/10.1051/0004-6361/202554817 | |
| Published online | 16 September 2025 | |
TransientVerse: A comprehensive real-time alert and multiwavelength analysis system for transient astronomical events
1
Research Center for Astronomical Computing, Zhejiang Laboratory,
Hangzhou
311121,
China
2
New Cornerstone Science Laboratory, Department of Astronomy, Tsinghua University,
Beijing
100084,
China
3
National Astronomical Observatories, Chinese Academy of Sciences,
Beijing
100101,
China
4
State Key Laboratory of Radio Astronomy and Technology, Chinese Academy of Sciences,
Beijing
100101,
China
5
Institute for Frontiers in Astronomy and Astrophysics, Beijing Normal University,
Beijing
102206,
China
6
School of Computer Science and Engineering, Sichuan University of Science and Engineering,
Yibin
644000,
China
7
Institute for Astronomy, School of Physics, Zhejiang University,
Hangzhou
310027,
China
8
Alibaba Group,
Hangzhou
311121,
China
9
College of Physics and Electronic Engineering, Qilu Normal University,
Jinan
250200,
China
10
School of Physics and Electronic Science, Guizhou Normal University,
Guiyang
550001,
China
11
College of Physical Science and Technology, Central China Normal University,
Wuhan
430079,
China
★ Corresponding authors: This email address is being protected from spambots. You need JavaScript enabled to view it.
; This email address is being protected from spambots. You need JavaScript enabled to view it.
; This email address is being protected from spambots. You need JavaScript enabled to view it.
Received:
28
March
2025
Accepted:
1
August
2025
Abstract
Transient astrophysical events, characterized by short timescales and high-energy radiation, are a key focus of modern astronomy. However, current transient alert systems face challenges, including the distribution of alerts across multiple platforms and inconsistencies in formatting, which hinder the efficient coordination of follow-up observations in multiwavelength and multi-messenger astronomy. This paper presents TransientVerse, an innovative platform designed to integrate and disseminate transient event alerts. The platform integrates an automated ingestion pipeline that aggregates alerts from multiple platforms (e.g., Astronomer’s Telegram (ATel), the Canadian Hydrogen Intensity Mapping Experiment (CHIME) Fast Radio Burst (FRB) Virtual Observatory Event (VOEvent), and the General Coordinates Network (GCN)). It uses large language models to extract structured information from unstructured alerts, storing both forms in separate databases to support efficient tracking and analysis. TransientVerse offers retrospective searches, data visualization, literature integration and linking, and interactive tools for efficient event tracking and follow-up. For repeating FRBs, the platform generates visualized sky maps and detection statistics from CHIME/FRB VOEvent messages, enabling time-range filtering, coordinate switching, and source ranking by burst frequency to support follow-up planning. TransientVerse improves the efficiency of real-time transient event acquisition, lowers the technical barriers for coordinated observations, and provides robust support for multiwavelength and multi-messenger time-domain astronomy, thereby facilitating astrophysics research.
Key words: methods: statistical / astronomical databases: miscellaneous / catalogs / virtual observatory tools
© The Authors 2025
 Open Access article, published by EDP Sciences, under the terms of the Creative Commons Attribution License (https://creativecommons.org/licenses/by/4.0), which permits unrestricted use, distribution, and reproduction in any medium, provided the original work is properly cited.
This article is published in open access under the Subscribe to Open model. This email address is being protected from spambots. You need JavaScript enabled to view it. to support open access publication.
1 Introduction
Transient sources are astronomical events that suddenly appear and disappear over short timescales. Typically associated with relativistic compact objects, they are linked to intense energetic processes such as supernovae (SNe), fast radio bursts (FRBs), and gamma-ray bursts (GRBs). The rapid, intense energy release in these events creates extreme physical conditions, rendering them invaluable probes for exploring fundamental astrophysical mechanisms. Consequently, they have emerged as a central focus of contemporary astronomical research. The rapid advancement of multiwavelength and multi-messenger astronomy has introduced new avenues for investigating such phenomena. Complementary messengers, including neutrinos, cosmic rays, and gravitational waves (GWs), enhance traditional electromagnetic observations, enabling a more comprehensive understanding of extreme astrophysical processes (Abbott et al. 2017; Mészáros et al. 2019).
The ephemeral nature of transient sources imposes stringent requirements on both observational facilities and real-time alert systems. These systems must rapidly detect and characterize high-energy astronomical events, such as SNe and GRBs, and disseminate alerts to the global observational community to enable timely multiwavelength and multi-messenger follow-up observations (Staley & Fender 2016; Nordin et al. 2019; Ayala Solares et al. 2020; Möller et al. 2021; Reichherzer et al. 2021).
With the construction and commissioning of next-generation astronomical facilities, multiwavelength and multi-messenger observations have emerged as a cornerstone of modern astronomy. Traditional observations, limited to single electromagnetic bands (e.g., optical or radio) or individual messengers (such as neutrinos, cosmic rays, or GWs), are insufficient to fully unravel the complexities of the universe. Consequently, the integration of multiwavelength and multi-messenger observations has become essential for advancing our understanding of astrophysical processes.
In the realm of multiwavelength astronomy, a new generation of telescopes, such as the Square Kilometer Array (SKA; Dewdney et al. 2009), China Space Station Telescope (CSST; Zhan 2011; Cao et al. 2018; Gong et al. 2019), Large Synoptic Survey Telescope (LSST; LSST Science Collaboration 2009; Ivezić et al. 2019), Advanced Telescope for High-Energy Astrophysics (ATHENA; Barret et al. 2018), and ground-based gamma-ray observatories such as the Large High Altitude Air Shower Observatory (LHAASO; Cao et al. 2019) and Cherenkov Telescope Array (CTA; Zanin et al. 2022), will cover a broad range of electromagnetic bands, from radio waves to optical, X-rays, and gamma-rays. In addition, the Five-hundred-meter Aperture Spherical Radio Telescope (FAST; Nan et al. 2011) plays a critical role in advancing radio astronomy, particularly in the detection and study of transient sources such as FRBs. These facilities are poised to significantly enhance our ability to observe transient sources and related cosmic events.
In the realm of multi-messenger astronomy, high-energy neutrino telescopes, exemplified by the IceCube Neutrino Observatory (IceCube; IceCube Collaboration 2013), cosmic ray detector arrays (such as the Pierre Auger Observatory and LHAASO; Pierre Auger Collaboration 2015; D’Ettorre Piazzoli et al. 2022), and GW detectors (including LIGO, Virgo, and KAGRA; Abbott et al. 2018), provide complementary data for transient source research. The synergy between multi-messenger and multiwavelength observations offers a multidimensional perspective on transient sources, revealing new insights into their nature and origins. However, the growing volume of real-time observational data and alert information presents significant challenges for efficient processing and dissemination.
To facilitate the real-time distribution of alert messages for follow-up observations using multiwavelength and multi-messenger instruments, it is essential to establish a workflow capable of processing, analyzing, and classifying these alerts. While existing platforms, such as Astronomer’s Telegram (ATel)1, the General Coordinates Network (GCN)2, and the Canadian Hydrogen Intensity Mapping Experiment FRB Virtual Observatory Event (CHIME/FRB VOEvent)3, have made significant contributions, they often face challenges such as the dispersion of alerts across multiple platforms and inconsistencies in their formats, which hinder automation and batch processing. Addressing these challenges requires a platform that can integrate and push transient source alerts in real time, significantly improving observational efficiency and enabling near-real-time multiwavelength follow-up observations.
In response to these challenges, we developed Transient-Verse4, a real-time notification platform that collects and integrates transient source alerts from multiple platforms, such as ATel, GCN, and CHIME/FRB VOEvent, through an automated pipeline. Leveraging large language models (LLMs), the platform parses textual data into structured formats, which are then promptly delivered to users via standardized templates, facilitating multiwavelength and multi-messenger follow-up observations. Additionally, TransientVerse provides retrospective search, visualization, and literature research functionalities, enabling users to efficiently analyze the collected alerts.
The paper is structured as follows. Section 2 discusses the scientific motivations, Section 3 describes the platform’s architecture and key features, Section 4 provides a detailed comparison with other platforms, and Section 5 presents a summary and future outlook.
2 Science drivers
Various transient astrophysical events, such as FRBs, GRBs, and GWs, require multiwavelength and multi-messenger observations to reveal their origins, physical mechanisms, and temporal evolution. The TransientVerse platform is designed to address these scientific challenges by providing real-time alerts, analysis tools, and follow-up observation support, enabling coordinated efforts across multiwavelength and multi-messenger domains.
2.1 Fast radio bursts
Fast radio bursts are the brightest transient phenomena in the radio band, with durations typically ranging from microseconds to milliseconds. Since the discovery of the first FRB (Lorimer et al. 2007), over 800 FRB sources have been identified (CHIME/FRB Collaboration 2021; Li et al. 2021b; Niu et al. 2022; Feng et al. 2022; Zhang et al. 2022; Xu et al. 2023). The Commensal Radio Astronomy FAST Survey (CRAFTS)5, a survey project conducted with FAST, has detected numerous FRBs, significantly expanded the sample available for population studies (Li et al. 2018; Niu et al. 2021). Furthermore, many FRBs cataloged in the BlinkVerse database6, which includes detections from FAST and other facilities, enable detailed statistical and population analyses (Xu et al. 2023). The origins and physical mechanisms of FRBs remain poorly understood. The first multiwavelength simultaneous observation of the FRB 20200428 event, originating from the Galactic magnetar SGR 1935+2154, was marked by the detection of bursts in both X-ray and radio bands (Mereghetti et al. 2020; Lin et al. 2020; Li et al. 2021a), significantly advancing our understanding of FRB origins. Notably, the occurrence of a “burst forest” in magnetars suggests that these sources may enter active phases, potentially generating FRBs similar to FRB 20200428 (Wang et al. 2024). This provides a unique opportunity for further research. Due to their short durations, FRBs are often not directly observable during coordinated multiwavelength campaigns. Therefore, followup observations of their afterglows are critical for unraveling their nature.
2.2 Gamma-ray bursts
Gamma-ray bursts are the most powerful electromagnetic bursts in the universe (Kumar & Zhang 2015), with durations ranging from a few tens of milliseconds to hundreds of seconds, and exceptionally up to several hours (Thöne et al. 2011; Gendre et al. 2013; Levan et al. 2014). Despite over 50 years of observations, key aspects of their jet physics, particle acceleration, and radiation mechanisms remain unresolved (Zhang 2019). Coordinated observations across multiple wavelengths are essential to advancing our understanding of these extreme events.
In 2022, the Fermi Gamma-Ray Burst Monitor (GBM) and the Swift Burst Alert Telescope (BAT) detected GRB 221009A, the brightest GRB ever recorded (Tan et al. 2022; Veres et al. 2022; Williams et al. 2023). The GBM issued the first alert with a localization uncertainty ranging from one degree to tens of degrees. The true localization accuracy is affected by systematic uncertainties, previously characterized by a core-plus-tail model, in which 90% of GRBs are within ~3.7°, while some exceed 10° (Connaughton et al. 2015). More recent analyses based on over 500 GRBs, using the RoboBA and BALROG algorithms, report systematic uncertainties of ~2°–4° for most GRBs, with a small fraction reaching up to ~30° (Goldstein et al. 2020). Swift BAT triggered nearly one hour later, and although both detections referred to the same event, their association was not immediately evident. This delay in establishing the connection, combined with the limited early localization, presented substantial challenges to coordinating timely followup (Veres et al. 2022). Despite these difficulties, GRB 221009A was eventually observed across radio, optical, X-ray, and very-high-energy bands, including photons up to 13 TeV detected by LHAASO (Huang et al. 2022; Laskar et al. 2023; Cao et al. 2023). Many experimental groups conducted multiwavelength follow-up observations of its afterglow (Laskar et al. 2023), underscoring the importance of both real-time alerts and continued monitoring during the afterglow phase. This event exemplifies the importance of integrated platforms like TransientVerse in consolidating multi-source alerts, minimizing latency, and facilitating timely coordination of multiwavelength and multi-messenger observations.
2.3 Gravitational waves
Gravitational waves are ripples in spacetime predicted by general relativity, propagating at the speed of light. They originate from extremely massive, strongly accelerated systems, such as the mergers of black holes or neutron stars. The first GW event, GW150914, detected by LIGO in 2015, was attributed to the coalescence of a binary black hole system (Abbott et al. 2016). Since then, a growing number of GW events have been observed. Among them, GW170817, detected in 2017 by LIGO and Virgo, was the first event with confirmed electromagnetic counterparts across multiwavelength observations (Lipunov et al. 2017). Its signals were detected in radio, ultraviolet, optical, infrared, and X-ray bands. Specifically, optical signals were observed within 11 hours of the merger, ultraviolet signals faded within 48 hours, and radio and X-ray emissions were detected approximately 16 and 9 days later, respectively. The optical and infrared signals also exhibited redshift evolution over a period of about 10 days. No counterparts were observed in the high-energy gamma-ray or neutrino bands. These multiwavelength and multi-messenger observations support the hypothesis that GW170817 was triggered by the merger of two neutron stars in NGC 4993 (Abbott et al. 2017).
The FRBs and GRBs may be associated with GWs, as these high-energy events likely originate from similar extreme systems, such as black hole or neutron star mergers. Their study could provide crucial insights into high-energy explosive phenomena. However, the search for multi-messenger and electromagnetic counterparts of GWs is challenging due to the significant uncertainty in sky localization. Additional telescopes are required to observe the regions identified by GW detectors. Moreover, as signals in different wavelength bands appear at varying time intervals, timely notification of GW alerts is essential for coordinating multiwavelength follow-up observations, which will help reveal the mechanisms behind GW production.
3 Overall architecture of the transient source platform
The architecture of the TransientVerse system is designed to integrate transient source alert messages, providing real-time notifications and enabling retrospective queries. It comprises two main components: the ingestion pipeline and application services. Figure 1 illustrates the role of each component in ensuring efficient data processing, storage, and user access.
3.1 Ingestion pipeline
Apache Airflow (Apache Software Foundation 2019) is an opensource platform for creating, scheduling, and monitoring workflows using a flexible Python framework. We applied Airflow to build the ingestion pipeline to work as the core infrastructure of TransientVerse, enabling the collection, processing, and storage of transient source alerts from multiple astronomical data sources. This pipeline is structured into three key stages: Alert Message Retrieval, Report Parsing, and Extraction to Search Engine.
3.1.1 Alert message retrieval
The first stage of the pipeline focuses on retrieving alert messages from diverse astronomical data sources. These messages are stored in their raw formats within cloud-based storage systems, which provide high availability and durability. The platform integrates three primary alert message sources, each with distinct characteristics and formats. Below, we provide a detailed description of these sources, followed by a summary of their key features in Table 1.
ATel: The Astronomer’s Telegram (ATel) is a web-based system for the rapid dissemination of astronomical observations (Rutledge 1998). While ATel provides real-time updates, its human-readable format lacks standardization, making automated data extraction challenging. To address this, the platform employs LLMs to parse and extract structured information from ATel reports.
CHIME/FRB VOEvent: VOEvent is a standardized, machine-readable format developed by the International Virtual Observatory Alliance (IVOA) for representing transient astronomical events in a structured and interoperable manner (Swinbank 2014b). While the format is broadly adopted across the astronomical community, including by systems such as GCN-notices, in the platform, the message source labeled as “VOEvent” refers specifically to the real-time alert stream issued by CHIME FRB collaboration, which distributes FRB detections using the VOEvent standard (Petroff et al. 2017; Abbott et al. 2024). These messages are transmitted via the VOEvent Transport Protocol (VTP), a lightweight protocol optimized for low-latency dissemination. We employed Comet7 (Swinbank 2014a), a widely used implementation of VTP, to subscribe to, forward, and optionally filter incoming VOEvent packets. Through this setup, CHIME/FRB alerts in a VOEvent format are ingested by the system immediately upon release. The received alerts are parsed and stored in the internal event database, where repeated bursts are automatically identified. The archived data are subsequently utilized by the platform for downstream scheduling, coordination, and user-defined follow-up strategies targeting high-frequency FRB activity.
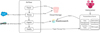
Fig. 1 System architecture of the TransientVerse platform for collecting and integrating transient astronomical alert messages. The data pipeline, orchestrated by Apache Airflow, comprises the four key stages: fetching (Fetch), parsing (Parse), ingestion (Ingest), and notification (Notify). The parsed data are archived in cloud storage and indexed in Elasticsearch to support fast and flexible querying. The TransientVerse server provides astronomers with tools for data management, subscription services, assistive utilities, and in-depth FRB analysis, thereby facilitating efficient monitoring and interpretation of transient alerts. The user subscription service is currently under development and not yet implemented.
Table 1Key attributes of astronomical alert message sources.
GCN: the GCN disseminates information on GRBs, GW events, and other high-energy transients (Barthelmy et al. 1995, 2001). GCN provides two types of messages: circulars and notices. Circulars are human-readable reports containing observational results, predictions, and follow-up requests, while notices are machine-readable real-time alerts with event localization data. The platform uses LLMs to extract structured information from circulars. For notices, the system filters messages directly based on their notice type to select only those related to genuine transient events, excluding routine system messages such as satellite position updates. Relevant parameters are subsequently parsed using custom-developed scripts to ensure precise and efficient data extraction.
Figure 2 illustrates the annual distribution of alerts from ATel, GCN circulars, and CHIME/FRB VOEvent, providing insights into the data volume and trends across these sources.
3.1.2 Report parsing
After acquiring reports, the system applies a standardized parsing procedure to extract relevant information. This stage combines LLMs with custom parsers to ensure high adaptability to heterogeneous formats and diverse message structures. LLMs are guided by carefully crafted prompts to process unstructured text, while custom parsers are applied to known file formats. The extracted information is then transformed into source-specific structured formats, enabling standardized storage, efficient querying, and seamless integration into downstream analysis.
To optimize the performance of the LLMs in this text parsing task, we meticulously designed prompts that include key components: role specification, task description, main objectives (with particular emphasis on fields like telescope names), and a well-crafted one-shot learning example. The role specification clarifies the model’s function, guiding it to identify and extract structured data from scientific reports. The task description explicitly outlines the objectives, such as extracting transient names, telescope identifiers, and astronomical coordinates (RA and Dec). Special attention is given to handling variations in the format of critical fields like telescope names, ensuring the model can correctly interpret and process diverse naming conventions.
A parsing example is included in the prompt to provide a clear demonstration of how the model should interpret the text. This one-shot learning approach allows the LLM to learn from a single example and apply that knowledge across the entire report. The input-output format is also clearly defined, ensuring that the model’s responses are structured and consistent.
In this study, we evaluated the parsing capabilities of several LLMs, including Deepseek-V3, ERNIE-4.5, ERNIE-4, GPT-4o, Qwen2.5-32B, and Qwen3-32B. These models were tested on two distinct datasets: 82 ATel reports and 90 GCN circulars. The fields selected for extraction vary by dataset: for ATels, the key fields include Transient Name, Transient Type, Telescope, RA (Right Ascension), Dec (Declination), Transient Uncertainty, and Transient Uncertainty Confidence; for GCN circulars, we focused on fields such as Event Name, Source Type, Telescope, RA, Dec, and Localization Error.
To systematically evaluate the information extraction capabilities of LLMs on unstructured astronomical alerts, we employed three complementary metrics: accuracy, precision, and coverage, which jointly assess the correctness and completeness of the extracted data. Accuracy is defined as the ratio of correctly matched extracted fields to all valid ground-truth fields, reflecting the overall agreement between model outputs and manual annotations. A prediction is counted as correct only if the model’s output exactly matches the annotated value for the corresponding field. Precision measures the proportion of correct predictions among all predictions made by the model, indicating its reliability and ability to avoid false positives or hallucinated content. Coverage quantifies the fraction of ground-truth fields that the model successfully predicts, directly reflecting its capacity to capture required information and minimize omissions. It is important to note that any prediction made for a field that is annotated as empty – regardless of whether the predicted value is contextually reasonable – is treated as incorrect. This design, which ensures a strict alignment with the ground truth, may lead to underestimated precision and accuracy scores in some cases. Nonetheless, these metrics remain effective for comparing model performance, and relative differences between models provide meaningful insight into their extraction capabilities under realistic conditions.
To present the evaluation results, we provide a detailed comparison across both ATel and GCN circular datasets. For each dataset, we report per-field accuracy, precision, and coverage scores, along with an overall average for each model. The full results are summarized in Table 2, which highlights performance variations across models and fields.
In the evaluation datasets, GPT-4o and Qwen3-32B ranked among the top two models in both accuracy and precision on the ATel reports. Meanwhile, for the GCN circulars, GPT-4o achieved the highest accuracy, and ERNIE-4.5 led in precision. Despite these variations, Qwen3-32B was ultimately adopted as the default parser in the TransientVerse system, as it consistently delivered competitive performance across both datasets and maintained favorable inference speed and integration stability. By combining high-quality LLM prompt design with tailored parsing strategies, this approach offers robust adaptability to diverse alert formats, reduces manual overhead, and enables the structured transformation of heterogeneous messages to support downstream analysis. Its structured outputs are seamlessly incorporated into downstream components for data archiving, multiwavelength correlation, and automated follow-up coordination.
The ingestion pipeline processes multiple categories of transient alerts, each exhibiting distinct latency characteristics. For unstructured textual alerts such as ATel and GCN circulars, the pipeline relies on a fine-tuned LLM to parse and extract structured data, with inference typically completed within one minute per message. Because the pipeline polls for new messages every two minutes, and multiple alerts may arrive within the same polling interval, these messages are processed sequentially. Consequently, the total latency from message reception to availability in the platform generally remains within five minutes. In contrast, structured alerts that conform to predefined formats are parsed by custom scripts without requiring LLM inference. These parsing operations typically complete within one minute, and when combined with the same two-minute polling interval, the overall latency for these messages is usually under three minutes. This latency encompasses message retrieval, parsing, and database registration, thereby enabling timely follow-up coordination for fast transients such as GRBs, GWs, and FRBs.
 |
Fig. 2 Annual number of messages from three astronomical sources: ATel (panel a), GCN-circulars (panel b), and CHIME/FRB VOEvent (panel c). Panel d illustrates the combined message count from all three sources. |
Comparison of named entity detection across different models.
3.1.3 Extraction to search engine
Both raw and processed data were ingested by Elasticsearch (ES)8, a robust search and analytics engine capable of handling large datasets and providing real-time search capabilities. To ensure consistency and accuracy, we integrated data from SIMBAD to retrieve coordinate positions and standardize transient names based on the source name (Wenger et al. 2000). This process produces uniform fields, enabling efficient relational queries and linking follow-up events associated with the same transient source. Such standardization enhances data usability and simplifies the process of tracking subsequent observations.
Additionally, ES’s geospatial capabilities are leveraged by mapping astronomical coordinates (RA and Dec) to a geographic coordinate system. This transformation allows the system to perform approximate geographic searches based on sky regions, significantly improving its ability to deliver relevant and precise results.
By combining standardized fields from SIMBAD with ES’s geospatial search features, the component provides a powerful and user-friendly solution for processing and querying astronomical data. Users can efficiently explore datasets and identify related observations.
3.2 Application services
The application services layer is designed to provide a seamless user experience, enabling efficient access to and interaction with transient source alerts. It offers the following key features: search, display, and subscription of transient source reports (to be implemented), as well as tools for quick investigation of sources mentioned in the reports. Additionally, the platform includes utility tools such as unit conversion tools and a “Research Assistant”. For CHIME/FRB VOEvent FRB alerts, the platform leverages historical alert data to highlight high-frequency FRB sources on sky maps, which are then pushed to astronomers to facilitate follow-up observations.
 |
Fig. 3 Home page of the TransientVerse platform. The upper section features a search interface with filters for source name, coordinates (with angular radius), subject, time range, source type, telescope, and keywords. The lower section displays recent alerts along with a sky map visualizing the spatial distribution of transient sources. |
3.2.1 Search for transient source alert messages
The TransientVerse homepage, shown in Figure 3, features a search interface at the top with fields for source name, coordinates (with angular radius), subject, time range, transient source type, observing telescope, and keywords. These criteria allow astronomers to filter messages and locate relevant transient source alerts. The bottom section of the page displays recent alerts alongside a sky map showing the spatial distribution of the involved sources.
When a search is executed, structured transient source alert messages matching the criteria are displayed, as shown in Figure 4. If no criteria are specified, submitting the search form or clicking “more” will retrieve the latest structured alert messages. These messages are extracted through custom parsers and LLMs.
3.2.2 Display of transient source alerts
The TransientVerse platform processes raw textual data into a structured format using LLMs, offering three primary methods for displaying transient source alerts: textual data, structured data, and an interactive sky map.
Textual data display: users can access the full text of a corresponding alert by clicking the “Report Title” in the structured data interface, preserving the original format of the alert. This ensures the integrity of the information and provides users with an efficient means of reviewing detailed content.
Structured data display: key information, such as source name, coordinates, observation time, and telescope name, is presented in a table format (see Table 3). For humanr-eadable texts from ATel and circulars, fields such as RA, Dec, RA_hms, Dec_hms, Loc_err, Source_Name, Report Subjects, Telescope, and Source_Type are extracted using LLMs, though the extraction accuracy is not guaranteed. Users can filter, analyze, and download selected reports in CSV format. Clicking on the “source name” reveals basic information retrieved from the SIMBAD database9, related reports, and papers from the Astrophysical Data System (ADS)10. Clicking the Report Title opens the original full alert message.
Interactive sky map display: as is shown in Figure 5, this feature utilizes the Aladin astronomical visualization tool (Baumann et al. 2022)11. It supports multiple coordinate projections (e.g., Aitoff, Mollweide, Orthographic, Mercator) and coordinate systems (e.g., Galactic and Equatorial). Additionally, it allows image overlays from visible light to radio wavelengths, enabling users to visualize sources across different bands. To assist with follow-up observations, the platform provides telescope coverage maps. Users can select telescopes from the bottom left corner, and their coverage areas are color-coded on the sky map.
The interlinking of these display methods facilitates seamless navigation. After applying filters, users can view structured alert messages on the “Source Report” page and then switch to the “Source Map” to visualize the filtered sources. Clicking on a source name in the report or its corresponding point (yellow star) on the map will display detailed source information. Additionally, clicking the Report Title opens the full textual version of the alert, enhancing analytical flexibility.
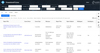 |
Fig. 4 Structured alert data representation on TransientVerse. The Report Title column provides a link to the original textual report, while the Source Name column displays detailed source information, including basic data, related alerts, and references to papers retrieved from the Astrophysical Data System (ADS). Key fields such as RA, Dec, RA_hms, Dec_hms, Loc_err, Source Name, Report Subjects, Telescope, and Source Type are extracted from the textual messages using LLMs. |
3.2.3 Brief literature survey for transient sources
When researchers encounter a new transient event in an astronomical alert, they often need to quickly gather comprehensive information about the source, including its basic properties, historical observations, and related literature. To address this need, TransientVerse provides a quick literature survey feature that enables users to seamlessly transition from reading an alert to conducting a thorough investigation of the associated transient source. This feature is designed to help users rapidly assess the scientific context and observational history of a source mentioned in an alert, facilitating more efficient follow-up studies.
Users can access this feature in two ways: (1) through the structured alert interface, where clicking on a source name directs users to a dedicated page, and (2) via the source map, where users can click on a source point and select “more info”. Both methods present three categories of information: (a) basic data retrieved from the SIMBAD database via its API, (b) historical observation alerts extracted from the TransientVerse-curated database, which aggregates and chronologically organizes reports from ATel, GCN, and CHIME/FRB VOEvent, and (c) relevant literature retrieved from the Astrophysical Data System (ADS). For literature search, the platform performs automated queries within ADS using source names as keywords, sorting results by relevance and citation count to display the top 20 papers. This ensures that researchers can quickly access the most influential and relevant studies. An example of this process for the source FRB 20240114A is shown in Figure 6, which includes (a) related alerts in chronological order and (b) relevant papers from ADS. By integrating these features, TransientVerse enables users to quickly obtain a comprehensive overview of transient sources mentioned in alerts, significantly enhancing their ability to conduct efficient and informed follow-up research.
3.2.4 Unit conversion toolkit
TransientVerse integrates a versatile unit conversion toolkit, conveniently positioned on the right side of the interface, allowing users to perform seamless conversions while analyzing transient source reports or conducting retrospective queries. The toolkit supports both interactive and batch processing for a broad range of astronomical units. Key functionalities include: (1) coordinate conversions between equatorial, galactic, and ecliptic coordinate systems, with support for sexagesimal, degrees, and radians; (2) time conversions between UTC, MJD, and JD, with automatic adjustments for telescope-specific time zones; (3) distance conversions between kilometers, astronomical units, parsecs, light years, and distance modulus; and (4) flux conversions between jansky, AB magnitude, and energy-based units such as watts per square metre per hertz and ergs per square centimetre per second per hertz. For batch processing, users can upload files containing multiple values, and the system automatically generates converted results for download. This feature allows users to effortlessly switch between units at any stage of their analysis, significantly enhancing workflow efficiency.
3.2.5 Observation planning assistance
TransientVerse provides an observation planning tool, located on the right side of the interface, to assist users in evaluating the visibility of transient sources for follow-up observations. Users can input source coordinates, select a telescope, specify the observation date, and set constraints such as the maximum zenith angle to generate detailed visibility predictions. As is shown in Figure 7, the tool displays two visualizations: (1) a time-elevation plot of the source’s elevation as a function of UTC time, with azimuthal information color-coded, and (2) a polar plot of the source’s trajectory, with azimuth represented angularly and zenith distance radially. The time-elevation plot also includes the moon’s altitude (dashed line) and the sun’s altitude (red line) for reference. Additionally, the tool provides the source’s precise rise and set times in UTC, enabling efficient observational planning.
Structured data fields from various alert message sources.
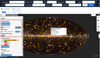 |
Fig. 5 Interactive sky map with multiwavelength overlays: This image shows an interactive sky map with multiwavelength layers, including a Fermi color layer (highlighted in red). The map allows users to overlay multiple wavelength bands and visualize celestial sources, with an elliptical red frame marking a source that can be clicked for detailed information (such as basic data, historical alerts, and related papers from ADS). In the upper left corner, users can select different coordinate systems; the lower left corner displays the visible sky regions of different telescopes; and the upper right corner offers different projection modes. |
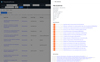 |
Fig. 6 Integrated literature survey interface for FRB 20240114A. The left panel displays structured alert reports about this source, while the right panel presents detailed information accessible by clicking the source name: (top) basic parameters from SIMBAD, (middle) historical observation reports curated by TransientVerse, and (bottom) relevant publications retrieved from ADS. This integrated interface enables efficient contextual analysis of transient sources. |
3.2.6 Detection statistics and follow-up planning for repeating FRBs
TransientVerse integrates a detection statistics feature specifically designed for repeating FRBs, leveraging CHIME/FRB VOEvent messages to provide users with actionable insights for follow-up observations. This feature is accessible through the Source Statistics interface, which is available exclusively when the message source is set to CHIME/FRB VOEvent. Users can filter repeating FRBs based on criteria such as the date range and repetition frequency. As is shown in Figure 8, the left panel displays a statistical sky map of repeating FRBs, where markers (represented as pentagrams) are color-coded by the number of detections. Solid red and black lines at 26.4° and 40° mark the zenith angle constraints for the FAST telescope, providing additional observational context. Users can toggle between equatorial and galactic coordinate systems using the control in the top left corner. The right panel presents a table listing the filtered FRBs, including their Name, RA, Dec, and Num of Detections. Clicking on a source reveals its individual detections, with details such as Event_id, Detected (detection time), RA, Dec, Localization_Error, DM, and S/N. Further interaction, such as clicking on an Event_id, provides access to detailed textual reports. By identifying and prioritizing high-frequency repeating FRBs, this feature significantly enhances the efficiency of follow-up observations, enabling astronomers to focus on the most scientifically valuable targets.
4 Comparison with other platforms
Current transient source alerts are scattered across multiple platforms, such as ATel, GCN, and CHIME/FRB VOEvent, leading to fragmentation that poses significant challenges for multiwavelength and multi-messenger observational research. To address this, the construction of an integrated alert platform for transient sources is urgently needed. Among existing solutions, Astro-COLIBRI (Reichherzer et al. 2021) stands out as a prominent platform for multiwavelength and multi-messenger data integration, demonstrating notable advantages in data fusion. To fully assess the innovative value and scientific contribution of TransientVerse, this study selects Astro-COLIBRI as the main comparison target. We systematically compare both platforms across four dimensions: architecture design, data integration, retrospective searching and visualization, and unique features. This comparison highlights the distinct characteristics of each platform and objectively presents the technological advantages and application value of TransientVerse.
 |
Fig. 7 Demonstration of the interaction observation planning tool. The left panel shows the source’s elevation as a function of UTC time, with color-coded azimuths, and includes the moon’s altitude (dashed line) and the sun’s altitude (red line) for reference. The right panel displays the target’s daily trajectory in polar coordinates, with azimuth represented angularly and zenith distance radially. The red curve traces the target’s path, and the green dot marks its position at the specified time. An example is shown for the FAST telescope, with the observation date set to 2025 January 1, source coordinates at RaJ 10:10:10 and DecJ 10:10:10, and a maximum zenith angle of 40°. The precise rise and set times in UTC are displayed on the right. |
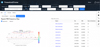 |
Fig. 8 Detection statistics and follow-up planning feature for repeating FRBs in TransientVerse. The left panel shows the statistical sky map of repeating FRBs, with pentagram markers color-coded by the number of detections (see the color bar). Solid red and black lines at 26.4° and 40° indicate the zenith angle constraints for the FAST telescope. Users can toggle between equatorial and galactic coordinates using the control in the top left corner. The right panel presents a table of FRBs filtered by user-defined criteria, including Name, RA, Dec, and Num of Detections. Clicking on a source reveals its individual detections, with details such as Event_id, Detected, RA, Dec, Localization_Error, DM, and S/N. Users can further access detailed textual reports by clicking on an Event_id. |
4.1 Architecture design
TransientVerse adopts a “source-centric” architecture, tightly aligning with the workflow of astronomers. Upon receiving a transient source alert, the platform automatically associates the source with relevant basic information, historical observation records, and related literature, enabling researchers to quickly grasp the scientific context of the target source. After understanding the source’s characteristics, researchers can use the platform’s observation planning tools to calculate the source’s visibility windows for specific telescopes, thereby formulating subsequent observation plans. This design creates a seamless research loop, from alert analysis to observation execution.
In contrast, Astro-COLIBRI employs an “event-centric” architecture, focusing on rapid response and collaborative analysis of individual alerts. The platform’s event discussion module facilitates academic exchange by allowing researchers to share insights and discuss observation strategies for specific events. In addition, Astro-COLIBRI provides observation support tools, including both nightly and monthly visibility plots, as well as integration with tilepy to assist in the optimized scheduling of follow-up observations for GW events. This design enhances collaboration among astronomers, facilitating communication from alert analysis to observation execution.
4.2 Data integration
In terms of data integration, TransientVerse collects alerts from platforms such as ATel, GCN, and CHIME/FRB VOEvent, providing comprehensive coverage across multiple wavelengths and messengers, with particular emphasis on supporting observations of FRBs and other radio transient sources. To handle the diversity and complexity of alert formats, the platform adopts a dual approach: LLMs are applied to extract key observational parameters from unstructured textual reports such as ATel and GCN circulars, while custom parsing tools are used for structured or semi-structured data formats, including GCN notices and CHIME/FRB VOEvent. This architecture enables precise querying, filtering, and downstream analysis, while also facilitating access to information that would otherwise be difficult to extract through traditional rule-based methods. All original alert messages are retained to ensure full data integrity and traceability.
In contrast, Astro-COLIBRI emphasizes multiwavelength data integration, particularly in the high-energy domain. The platform primarily employs unstructured database systems, such as MongoDB and Firebase Firestore, to manage and disseminate alert data efficiently.
The primary difference between the two platforms lies in their approach to message processing: TransientVerse leverages LLMs to transform unstructured textual alerts – such as ATel and GCN circulars – into structured data formats. This approach enables the extraction of scientifically relevant parameters that are often inaccessible to rule-based or keyword-driven systems, representing a significant technical advantage over platforms lacking such capabilities. By preserving the original content alongside the structured output, TransientVerse ensures both flexible access and traceability. In contrast, Astro-COLIBRI adopts a design based on unstructured database frameworks, emphasizing efficient data ingestion and rapid dissemination. While both platforms aim to support timely response to transient alerts, TransientVerse further improves scientific usability by enabling downstream analysis and response based on structured information extracted from unstructured messages.
4.3 Retrospective searching and visualization
For retrospective searching and visualization, TransientVerse offers a multidimensional data presentation system that allows users to query and filter data based on various conditions. The platform provides three complementary display modes: raw textual display, structured report display, and sky map visualization. These modes are interconnected, enabling users to access key information, historical observation reports, and related literature for specific sources directly through both the sky map and structured report displays. The sky map supports multiple coordinate systems (e.g., equatorial, galactic) and projection types, with the ability to overlay visibility regions of different telescopes, offering an intuitive tool for observation planning.
In contrast, Astro-COLIBRI utilizes a time-based visualization approach. Users can adjust the time range and filter events by selecting different telescopes and source types. Events are displayed on a timeline, with different markers indicating the source types of the events. Additionally, the platform provides sky maps and raw textual displays, making it easier for users to focus on events within specific time windows.
Both platforms utilize Aladin for sky map visualization and support overlaying different telescope layers. TransientVerse features a multidimensional display approach with flexible querying capabilities, which supports detailed analysis of transient events. Astro-COLIBRI, on the other hand, adopts a time-based visualization design, facilitating the browsing of events within specific time windows and allowing for comparisons across multiple events.
4.4 Unique features
In terms of unique features, TransientVerse has developed a specialized analysis tool based on CHIME/FRB VOEvent statistics to support observations of repeating FRBs, which can be applied to various telescopes, including the FAST telescope. This tool allows users to define custom time ranges and generates statistics on the detection frequency of CHIME/FRB VOEvent messages related to FRB outbursts. Researchers can use these visualized statistics to quickly identify high-frequency burst targets, and combine this with the platform’s telescope visibility analysis to plan subsequent observations. This feature can improve the observational efficiency of large radio telescopes, such as FAST, in detecting repeating FRBs. In contrast, Astro-COLIBRI offers a mobile application that provides researchers with real-time alert notifications, enhancing portability and allowing for quick access to transient source events from anywhere.
5 Discussion and conclusion
The TransientVerse platform addresses critical challenges in transient astronomy through three key innovations: (1) a source-centric architecture enabling comprehensive contextual analysis, (2) automated structuring of heterogeneous alert data while preserving provenance, and (3) specialized tools for time-domain studies including repeating FRB analysis. Our system demonstrates streamlining transient source alert management by integrating data from multiple transient alert systems. With its focus on transient sources and alignment with the research workflows of astronomers, TransientVerse improves the speed and efficiency of alert analysis, literature access, and followup observation planning. This architecture facilitates a smooth transition from data analysis to observational execution, thereby supporting multiwavelength and multi-messenger observations of transient events.
5.1 Key features
TransientVerse platform provides the following key capabilities:
Integration and structuring of alert messages: TransientVerse integrates alerts from multiple transient alert systems and employs LLMs and custom parsers to convert raw textual alerts into structured data. This structured approach enhances data consistency, enabling efficient filtering, querying, and downloading of alerts for further analysis. It allows users to easily track events, gain comprehensive insights, and access key information quickly. Additionally, the platform offers users direct links to the original unstructured alert messages, ensuring transparency and providing context when needed. This system supports the addition of new platforms and telescope systems, enabling future expansion and adaptation to evolving needs.
Historical data retrieval and query: TransientVerse offers flexible querying capabilities, enabling users to retrieve historical alert data based on parameters such as the time range and source type. This feature facilitates longitudinal studies on transient sources and supports the downloading of structured data for further analysis, providing users with the tools necessary for in-depth scientific research.
Sky map visualization: TransientVerse provides sky map visualizations of transient sources, supporting multiple coordinate systems and projection modes. Users can overlay telescope visibility regions to quickly assess whether a target is observable, facilitating efficient observation planning.
Source investigation and literature support: By querying the source name of a transient source, users can access basic information, historical observation alerts, and related academic literature. This feature allows researchers to quickly gain insights into the source’s historical observations and current research status, supporting subsequent observation plans and further studies.
Detection statistics for repeating FRBs: TransientVerse provides detection statistics for repeating FRBs by analyzing recent CHIME/FRB VOEvent data. This feature allows users to filter FRBs by detection frequency, enhancing follow-up planning and improving observation efficiency for high-priority targets.
5.2 Future developments
The platform will continue to expand its data ecosystem by incorporating additional transient source platforms, such as the Transient Name Server, to enhance the coverage and timeliness of event detection. This expansion will enrich the available data resources and improve the platform’s responsiveness and analytical capabilities for transient events. Furthermore, the introduction of a user management system will allow users to customize their alert subscriptions based on preferred source types or wavelength ranges, ensuring more personalized and timely notifications. These developments will not only meet the needs of current users but also facilitate future advancements in multiwavelength and multi-messenger astronomy.
Acknowledgements
This work is supported by the National Natural Science Foundation of China (NSFC) Programs (No. 12588202, U1731238, U2031117, 12203045); the CAS International Partnership Program (No. 114-A11KYSB20160008, 114-A11KYSB20210010); the CAS Strategic Priority Research Program (No. XDB23000000); the National Key R&D Program of China (No. 2017YFA0402600, 2023YFC2206403, 2022ZD0115305, 2023YFE0110500, QN2023061004L); and the National SKA Program of China (No. 2020SKA0120200, 2022SKA0130104, 2022SKA0130100). P.W. acknowledges support from the CAS Youth Interdisciplinary Team, the Youth Innovation Promotion Association CAS (id. 2021055). Y.F. is supported by the Leading Innovation and Entrepreneurship Team of Zhejiang Province of China (No. 2023R01008), and by Key R&D Program of Zhejiang (No. 2024SSYS0012).
References
- Abbott, B. P., Abbott, R., Abbott, T. D., et al. 2016, Phys. Rev. Lett., 116, 241102 [NASA ADS] [CrossRef] [Google Scholar]
- Abbott, B. P., Abbott, R., Abbott, T. D., et al. 2017, ApJ, 848, L12 [Google Scholar]
- Abbott, B. P., Abbott, R., Abbott, T. D., et al. 2018, Liv. Rev. Relativ., 21, 3 [Google Scholar]
- Abbott, T., Shiny., & Alcalá, O. 2024, https://doi.org/10.5281/zenodo.14008387 [Google Scholar]
- Apache Software Foundation 2019, Apache Airflow, http://apache.org/apache.org/, accessed: 2025-05-27 [Google Scholar]
- Ayala Solares, H. A., Coutu, S., Cowen, D. F., et al. 2020, Astropart. Phys., 114, 68 [Google Scholar]
- Barret, D., Lam Trong, T., den Herder, J.-W., et al. 2018, SPIE Conf. Ser., 10699, 106991G [Google Scholar]
- Barthelmy, S. D., Butterworth, P., Cline, T. L., et al. 1995, Ap&SS, 231, 235 [NASA ADS] [CrossRef] [Google Scholar]
- Barthelmy, S. D., Cline, T. L., & Butterworth, P. 2001, AIP Conf. Ser., 587, 213 [Google Scholar]
- Baumann, M., Boch, T., Pineau, F.-X., et al. 2022, ASP Conf. Ser., 532, 7 [NASA ADS] [Google Scholar]
- Cao, Y., Gong, Y., Meng, X.-M., et al. 2018, MNRAS, 480, 2178 [Google Scholar]
- Cao, Z., Aharonian, F., An, Q., et al. 2023, Sci. Adv., 9, eadj2778 [CrossRef] [Google Scholar]
- Cao, Z., della Volpe, D., Liu, S., et al. 2019, arXiv e-prints [arXiv:1905.02773] [Google Scholar]
- CHIME/FRB Collaboration (Amiri, M., et al.) 2021, ApJS, 257, 59 [NASA ADS] [CrossRef] [Google Scholar]
- Connaughton, V., Briggs, M. S., Goldstein, A., et al. 2015, ApJS, 216, 32 [Google Scholar]
- D’Ettorre Piazzoli, B., Liu, S.-M., della Volpe, D., et al. 2022, Chinese Phys. C, 46, 030004 [Google Scholar]
- Dewdney, P. E., Hall, P. J., Schilizzi, R. T., & Lazio, T. J. L. W. 2009, IEEE Proc., 97, 1482 [Google Scholar]
- Feng, Y., Li, D., Yang, Y.-P., et al. 2022, Science, 375, 1266 [NASA ADS] [CrossRef] [Google Scholar]
- Gendre, B., Stratta, G., Atteia, J. L., et al. 2013, ApJ, 766, 30 [Google Scholar]
- Goldstein, A., Fletcher, C., Veres, P., et al. 2020, ApJ, 895, 40 [Google Scholar]
- Gong, Y., Liu, X., Cao, Y., et al. 2019, ApJ, 883, 203 [NASA ADS] [CrossRef] [Google Scholar]
- Huang, Y., Hu, S., Chen, S., et al. 2022, GRB Coordinates Network, 32677, 1 [Google Scholar]
- IceCube Collaboration 2013, Science, 342, 1242856 [Google Scholar]
- Ivezić, Ž., Kahn, S. M., Tyson, J. A., et al. 2019, ApJ, 873, 111 [Google Scholar]
- Kumar, P., & Zhang, B. 2015, Phys. Rep., 561, 1 [Google Scholar]
- Laskar, T., Alexander, K. D., Margutti, R., et al. 2023, ApJ, 946, L23 [NASA ADS] [CrossRef] [Google Scholar]
- Levan, A. J., Tanvir, N. R., Starling, R. L. C., et al. 2014, ApJ, 781, 13 [Google Scholar]
- Li, D., Wang, P., Qian, L., et al. 2018, IEEE Microwave Magazine, 19, 112 [Google Scholar]
- Li, C. K., Lin, L., Xiong, S. L., et al. 2021a, Nat. Astron, 5, 378 [Google Scholar]
- Li, D., Wang, P., Zhu, W. W., et al. 2021b, Nature, 598, 267 [CrossRef] [Google Scholar]
- Lin, L., Zhang, C. F., Wang, P., et al. 2020, Nature, 587, 63 [Google Scholar]
- Lipunov, V. M., Gorbovskoy, E., Kornilov, V. G., et al. 2017, GRB Coordinates Network, 21587, 1 [Google Scholar]
- Lorimer, D. R., Bailes, M., McLaughlin, M. A., Narkevic, D. J., & Crawford, F. 2007, Science, 318, 777 [Google Scholar]
- LSST Science Collaboration (Abell, P. A., et al.) 2009, arXiv e-prints [arXiv:0912.0201] [Google Scholar]
- Mereghetti, S., Savchenko, V., Ferrigno, C., et al. 2020, ApJ, 898, L29 [Google Scholar]
- Mészáros, P., Fox, D. B., Hanna, C., & Murase, K. 2019, Nat. Rev. Phys., 1, 585 [Google Scholar]
- Möller, A., Peloton, J., Ishida, E. E. O., et al. 2021, MNRAS, 501, 3272 [CrossRef] [Google Scholar]
- Nan, R., Li, D., Jin, C., et al. 2011, Int. J. Mod. Phys. D, 20, 989 [Google Scholar]
- Niu, C.-H., Li, D., Luo, R., et al. 2021, ApJ, 909, L8 [NASA ADS] [CrossRef] [Google Scholar]
- Niu, C. H., Aggarwal, K., Li, D., et al. 2022, Nature, 606, 873 [NASA ADS] [CrossRef] [Google Scholar]
- Nordin, J., Brinnel, V., van Santen, J., et al. 2019, A&A, 631, A147 [NASA ADS] [CrossRef] [EDP Sciences] [Google Scholar]
- Petroff, E., Houben, L., Bannister, K., et al. 2017, arXiv e-prints [arXiv:1710.08155] [Google Scholar]
- Pierre Auger Collaboration 2015, Nucl. Instrum. Methods Phys. Res. A, 798, 172 [Google Scholar]
- Reichherzer, P., Schüssler, F., Lefranc, V., et al. 2021, ApJS, 256, 5 [NASA ADS] [CrossRef] [Google Scholar]
- Rutledge, R. E. 1998, PASP, 110, 754 [NASA ADS] [CrossRef] [Google Scholar]
- Staley, T. D., & Fender, R. 2016, arXiv e-prints [arXiv:1606.03735] [Google Scholar]
- Swinbank, J. 2014a, Astron. Comput., 7, 12 [CrossRef] [Google Scholar]
- Swinbank, J. 2014b, in The Third Hot-wiring the Transient Universe Workshop, eds. P. R. Wozniak, M. J. Graham, A. A. Mahabal, & R. Seaman, 105 [Google Scholar]
- Tan, W. J., Li, C. K., Ge, M. Y., et al. 2022, ATel, 15660, 1 [Google Scholar]
- Thöne, C. C., de Ugarte Postigo, A., Fryer, C. L., et al. 2011, Nature, 480, 72 [CrossRef] [Google Scholar]
- Veres, P., Burns, E., Bissaldi, E., et al. 2022, GRB Coordinates Network, 32636, 1 [NASA ADS] [Google Scholar]
- Wang, P., Li, J., Ji, L., et al. 2024, ApJS, 275, 39 [Google Scholar]
- Wenger, M., Ochsenbein, F., Egret, D., et al. 2000, A&AS, 143, 9 [NASA ADS] [CrossRef] [EDP Sciences] [Google Scholar]
- Williams, M. A., Kennea, J. A., Dichiara, S., et al. 2023, ApJ, 946, L24 [NASA ADS] [CrossRef] [Google Scholar]
- Xu, J., Feng, Y., Li, D., et al. 2023, Universe, 9, 330 [NASA ADS] [CrossRef] [Google Scholar]
- Zanin, R., Abdalla, H., Abe, H., et al. 2022, in 37th International Cosmic Ray Conference, 5 [Google Scholar]
- Zhan, H. 2011, Scientia Sinica Physica, Mechanica & Astronomica, 41, 1441 [Google Scholar]
- Zhang, B. 2019, The Physics of Gamma-ray Bursts (Cambridge: Cambridge University Press) [Google Scholar]
- Zhang, Y.-K., Wang, P., Feng, Y., et al. 2022, Res. Astron. Astrophys., 22, 124002 [CrossRef] [Google Scholar]
All Tables
All Figures
|
Fig. 1 System architecture of the TransientVerse platform for collecting and integrating transient astronomical alert messages. The data pipeline, orchestrated by Apache Airflow, comprises the four key stages: fetching (Fetch), parsing (Parse), ingestion (Ingest), and notification (Notify). The parsed data are archived in cloud storage and indexed in Elasticsearch to support fast and flexible querying. The TransientVerse server provides astronomers with tools for data management, subscription services, assistive utilities, and in-depth FRB analysis, thereby facilitating efficient monitoring and interpretation of transient alerts. The user subscription service is currently under development and not yet implemented. |
| In the text | |
|
Fig. 2 Annual number of messages from three astronomical sources: ATel (panel a), GCN-circulars (panel b), and CHIME/FRB VOEvent (panel c). Panel d illustrates the combined message count from all three sources. |
| In the text | |
|
Fig. 3 Home page of the TransientVerse platform. The upper section features a search interface with filters for source name, coordinates (with angular radius), subject, time range, source type, telescope, and keywords. The lower section displays recent alerts along with a sky map visualizing the spatial distribution of transient sources. |
| In the text | |
|
Fig. 4 Structured alert data representation on TransientVerse. The Report Title column provides a link to the original textual report, while the Source Name column displays detailed source information, including basic data, related alerts, and references to papers retrieved from the Astrophysical Data System (ADS). Key fields such as RA, Dec, RA_hms, Dec_hms, Loc_err, Source Name, Report Subjects, Telescope, and Source Type are extracted from the textual messages using LLMs. |
| In the text | |
|
Fig. 5 Interactive sky map with multiwavelength overlays: This image shows an interactive sky map with multiwavelength layers, including a Fermi color layer (highlighted in red). The map allows users to overlay multiple wavelength bands and visualize celestial sources, with an elliptical red frame marking a source that can be clicked for detailed information (such as basic data, historical alerts, and related papers from ADS). In the upper left corner, users can select different coordinate systems; the lower left corner displays the visible sky regions of different telescopes; and the upper right corner offers different projection modes. |
| In the text | |
|
Fig. 6 Integrated literature survey interface for FRB 20240114A. The left panel displays structured alert reports about this source, while the right panel presents detailed information accessible by clicking the source name: (top) basic parameters from SIMBAD, (middle) historical observation reports curated by TransientVerse, and (bottom) relevant publications retrieved from ADS. This integrated interface enables efficient contextual analysis of transient sources. |
| In the text | |
|
Fig. 7 Demonstration of the interaction observation planning tool. The left panel shows the source’s elevation as a function of UTC time, with color-coded azimuths, and includes the moon’s altitude (dashed line) and the sun’s altitude (red line) for reference. The right panel displays the target’s daily trajectory in polar coordinates, with azimuth represented angularly and zenith distance radially. The red curve traces the target’s path, and the green dot marks its position at the specified time. An example is shown for the FAST telescope, with the observation date set to 2025 January 1, source coordinates at RaJ 10:10:10 and DecJ 10:10:10, and a maximum zenith angle of 40°. The precise rise and set times in UTC are displayed on the right. |
| In the text | |
|
Fig. 8 Detection statistics and follow-up planning feature for repeating FRBs in TransientVerse. The left panel shows the statistical sky map of repeating FRBs, with pentagram markers color-coded by the number of detections (see the color bar). Solid red and black lines at 26.4° and 40° indicate the zenith angle constraints for the FAST telescope. Users can toggle between equatorial and galactic coordinates using the control in the top left corner. The right panel presents a table of FRBs filtered by user-defined criteria, including Name, RA, Dec, and Num of Detections. Clicking on a source reveals its individual detections, with details such as Event_id, Detected, RA, Dec, Localization_Error, DM, and S/N. Users can further access detailed textual reports by clicking on an Event_id. |
| In the text | |
Current usage metrics show cumulative count of Article Views (full-text article views including HTML views, PDF and ePub downloads, according to the available data) and Abstracts Views on Vision4Press platform.
Data correspond to usage on the plateform after 2015. The current usage metrics is available 48-96 hours after online publication and is updated daily on week days.
Initial download of the metrics may take a while.