Fig. 7
Download original image
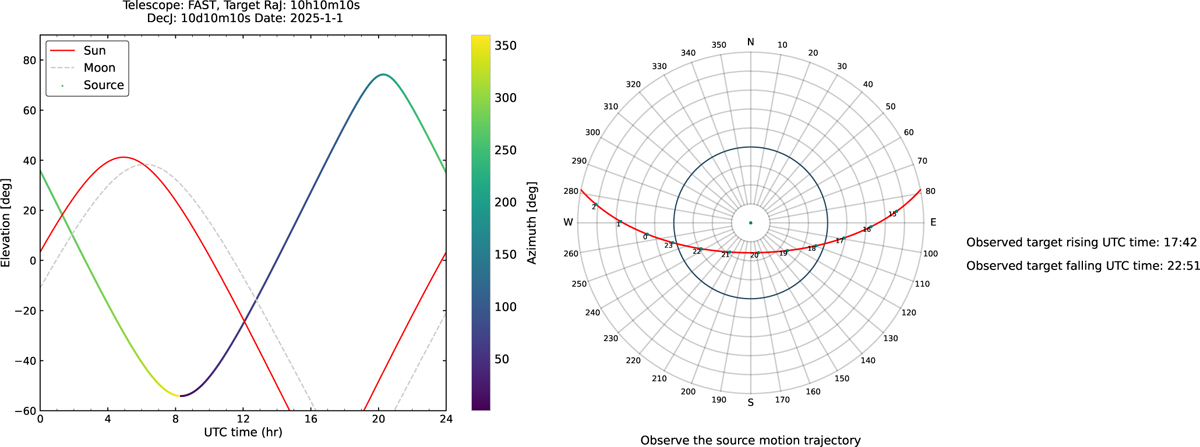
Demonstration of the interaction observation planning tool. The left panel shows the source’s elevation as a function of UTC time, with color-coded azimuths, and includes the moon’s altitude (dashed line) and the sun’s altitude (red line) for reference. The right panel displays the target’s daily trajectory in polar coordinates, with azimuth represented angularly and zenith distance radially. The red curve traces the target’s path, and the green dot marks its position at the specified time. An example is shown for the FAST telescope, with the observation date set to 2025 January 1, source coordinates at RaJ 10:10:10 and DecJ 10:10:10, and a maximum zenith angle of 40°. The precise rise and set times in UTC are displayed on the right.
Current usage metrics show cumulative count of Article Views (full-text article views including HTML views, PDF and ePub downloads, according to the available data) and Abstracts Views on Vision4Press platform.
Data correspond to usage on the plateform after 2015. The current usage metrics is available 48-96 hours after online publication and is updated daily on week days.
Initial download of the metrics may take a while.