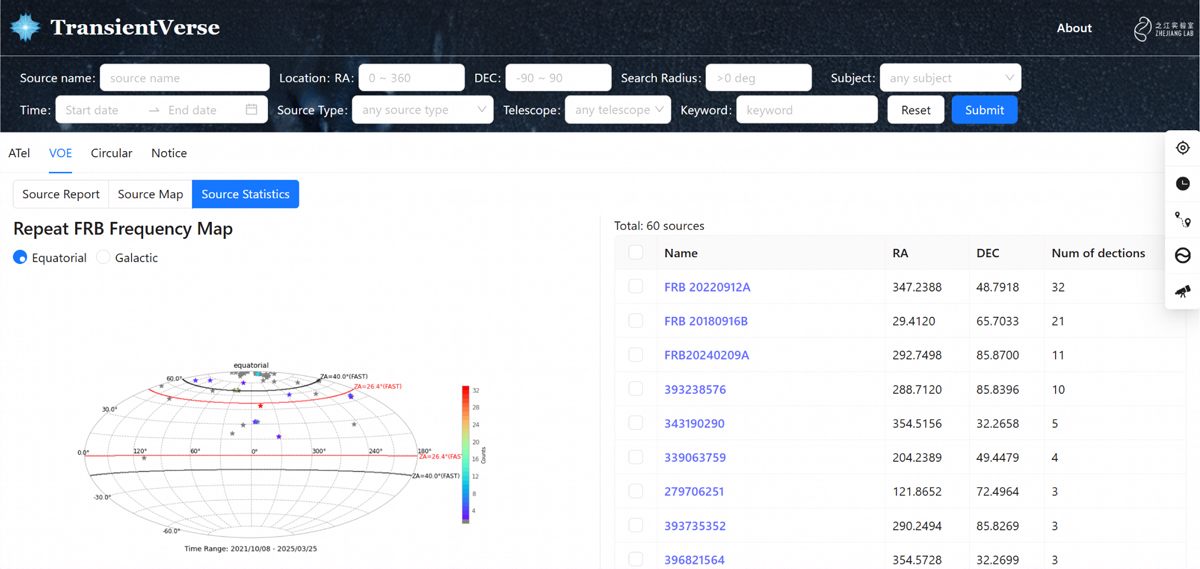
Fig. 8
Download original image
Detection statistics and follow-up planning feature for repeating FRBs in TransientVerse. The left panel shows the statistical sky map of repeating FRBs, with pentagram markers color-coded by the number of detections (see the color bar). Solid red and black lines at 26.4° and 40° indicate the zenith angle constraints for the FAST telescope. Users can toggle between equatorial and galactic coordinates using the control in the top left corner. The right panel presents a table of FRBs filtered by user-defined criteria, including Name, RA, Dec, and Num of Detections. Clicking on a source reveals its individual detections, with details such as Event_id, Detected, RA, Dec, Localization_Error, DM, and S/N. Users can further access detailed textual reports by clicking on an Event_id.
Current usage metrics show cumulative count of Article Views (full-text article views including HTML views, PDF and ePub downloads, according to the available data) and Abstracts Views on Vision4Press platform.
Data correspond to usage on the plateform after 2015. The current usage metrics is available 48-96 hours after online publication and is updated daily on week days.
Initial download of the metrics may take a while.