Open Access
Fig. 12
Download original image
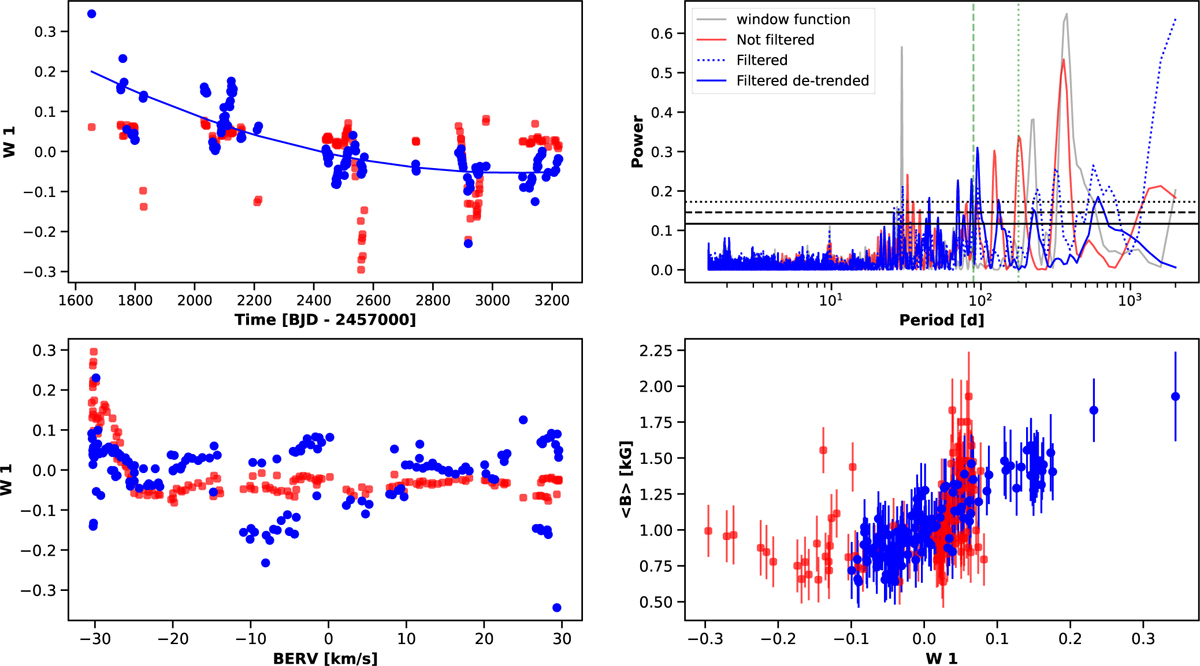
W1 signal of GJ1286 before (red) and after (blue) our filtering technique. Panels are the same as in Fig. 6. The periodogram of this figure was obtained by removing a quadratic trend from the filtered W1 beforehand (visible as a blue full line). The original periodogram of the filtered data is still visible (dotted line).
Current usage metrics show cumulative count of Article Views (full-text article views including HTML views, PDF and ePub downloads, according to the available data) and Abstracts Views on Vision4Press platform.
Data correspond to usage on the plateform after 2015. The current usage metrics is available 48-96 hours after online publication and is updated daily on week days.
Initial download of the metrics may take a while.