Open Access
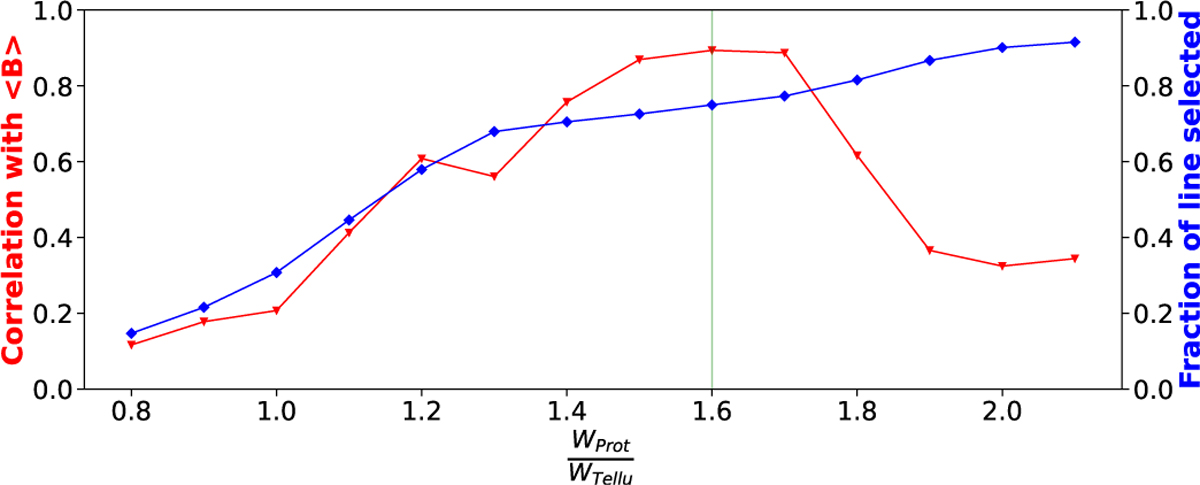
Fig. 13
Download original image
Fraction of lines kept after filtering (blue) and Correlation between the small-scale magnetic field signal and the filtered W1 (red) as a function of the activity class additional relative weighting while performing the SVM for the star GJ1286. The green vertical line represents the weighting ratio chosen for the SVM.
Current usage metrics show cumulative count of Article Views (full-text article views including HTML views, PDF and ePub downloads, according to the available data) and Abstracts Views on Vision4Press platform.
Data correspond to usage on the plateform after 2015. The current usage metrics is available 48-96 hours after online publication and is updated daily on week days.
Initial download of the metrics may take a while.