Fig. A.1
Download original image
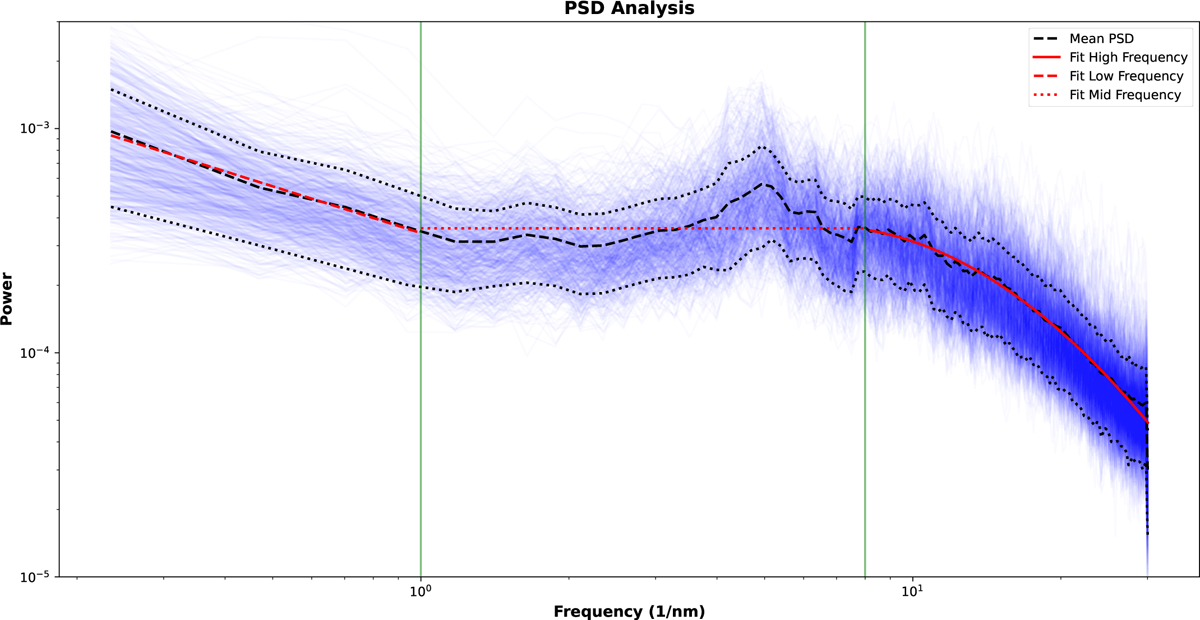
Power spectral density of the SPIRou spectral noise after APERO corrections and reductions. In blue are every individual spectra while in dashed black is the averaged PSD profile (± its standard deviation in dotted lines). The red dashed, dotted and full lines are the fitted PSD profiles for respectively low, mid and high frequencies. The green vertical lines indicating the cut-off frequencies between those regimes.
Current usage metrics show cumulative count of Article Views (full-text article views including HTML views, PDF and ePub downloads, according to the available data) and Abstracts Views on Vision4Press platform.
Data correspond to usage on the plateform after 2015. The current usage metrics is available 48-96 hours after online publication and is updated daily on week days.
Initial download of the metrics may take a while.