Open Access
Fig. 3
Download original image
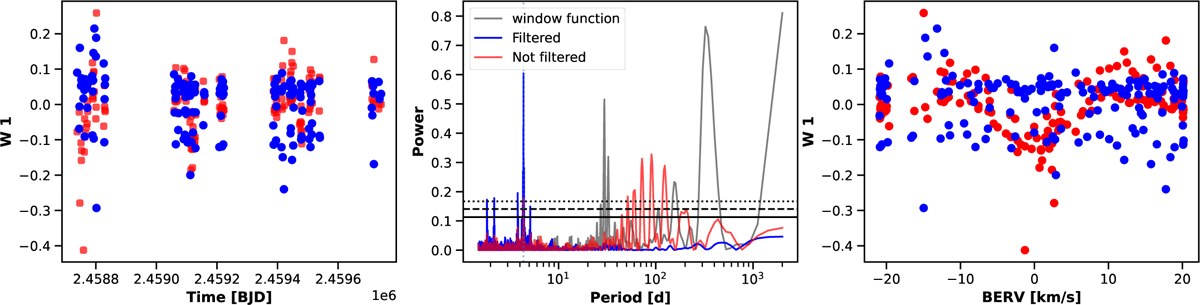
W1 signal of the simulated dataset before (red) and after (blue) our filtering technique. The left panel is the time series, the middle panel is its LS-periodogram, and the right panel is W1 as a function of the BERV. The gray curve represents the window function, illustrating time sampling effects.
Current usage metrics show cumulative count of Article Views (full-text article views including HTML views, PDF and ePub downloads, according to the available data) and Abstracts Views on Vision4Press platform.
Data correspond to usage on the plateform after 2015. The current usage metrics is available 48-96 hours after online publication and is updated daily on week days.
Initial download of the metrics may take a while.