Open Access
Fig. 5
Download original image
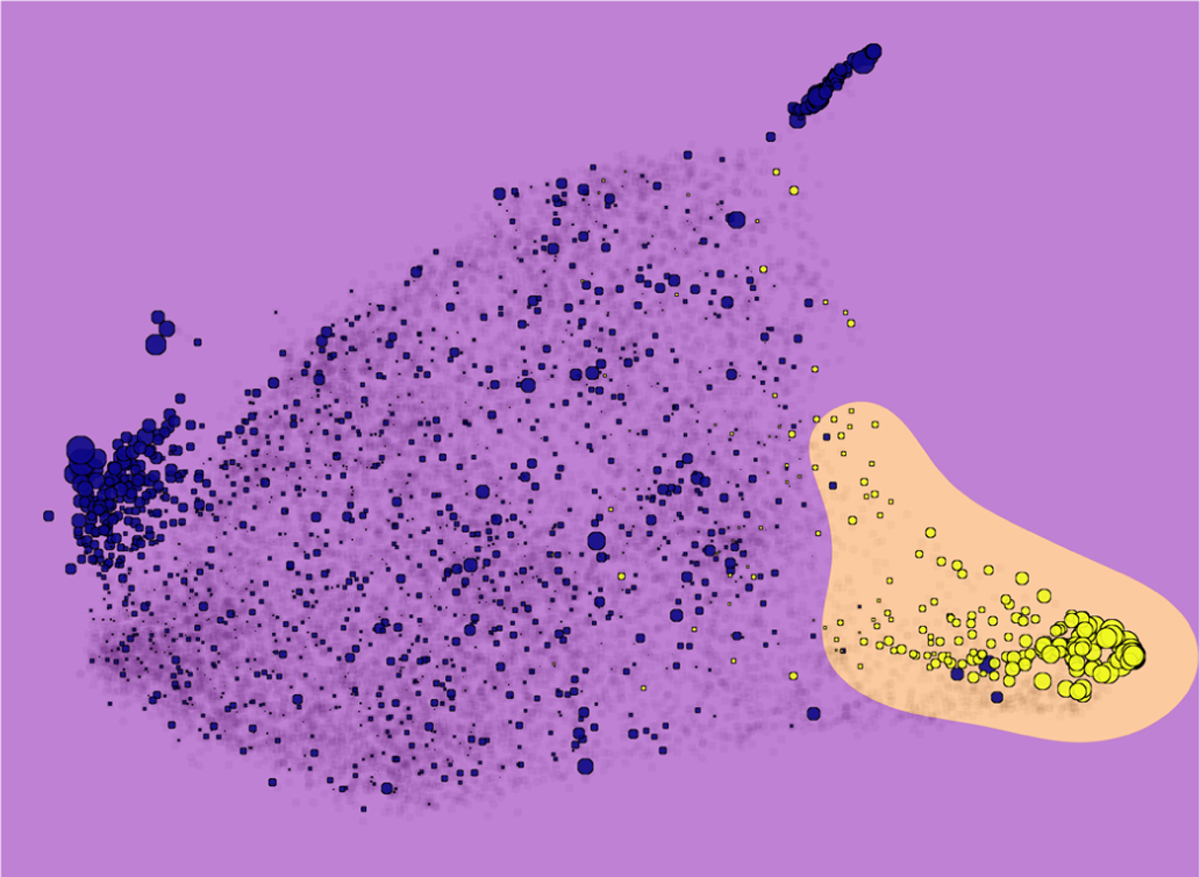
Support vector machine separation of the output PaCMAP map. The SVM has been fed using two clouds of points corresponding to lines identified as telluric contaminated (yellow points) or sensitive to the activity (purple point). The SVM has identified their two relative areas.
Current usage metrics show cumulative count of Article Views (full-text article views including HTML views, PDF and ePub downloads, according to the available data) and Abstracts Views on Vision4Press platform.
Data correspond to usage on the plateform after 2015. The current usage metrics is available 48-96 hours after online publication and is updated daily on week days.
Initial download of the metrics may take a while.