Open Access
Fig. 6
Download original image
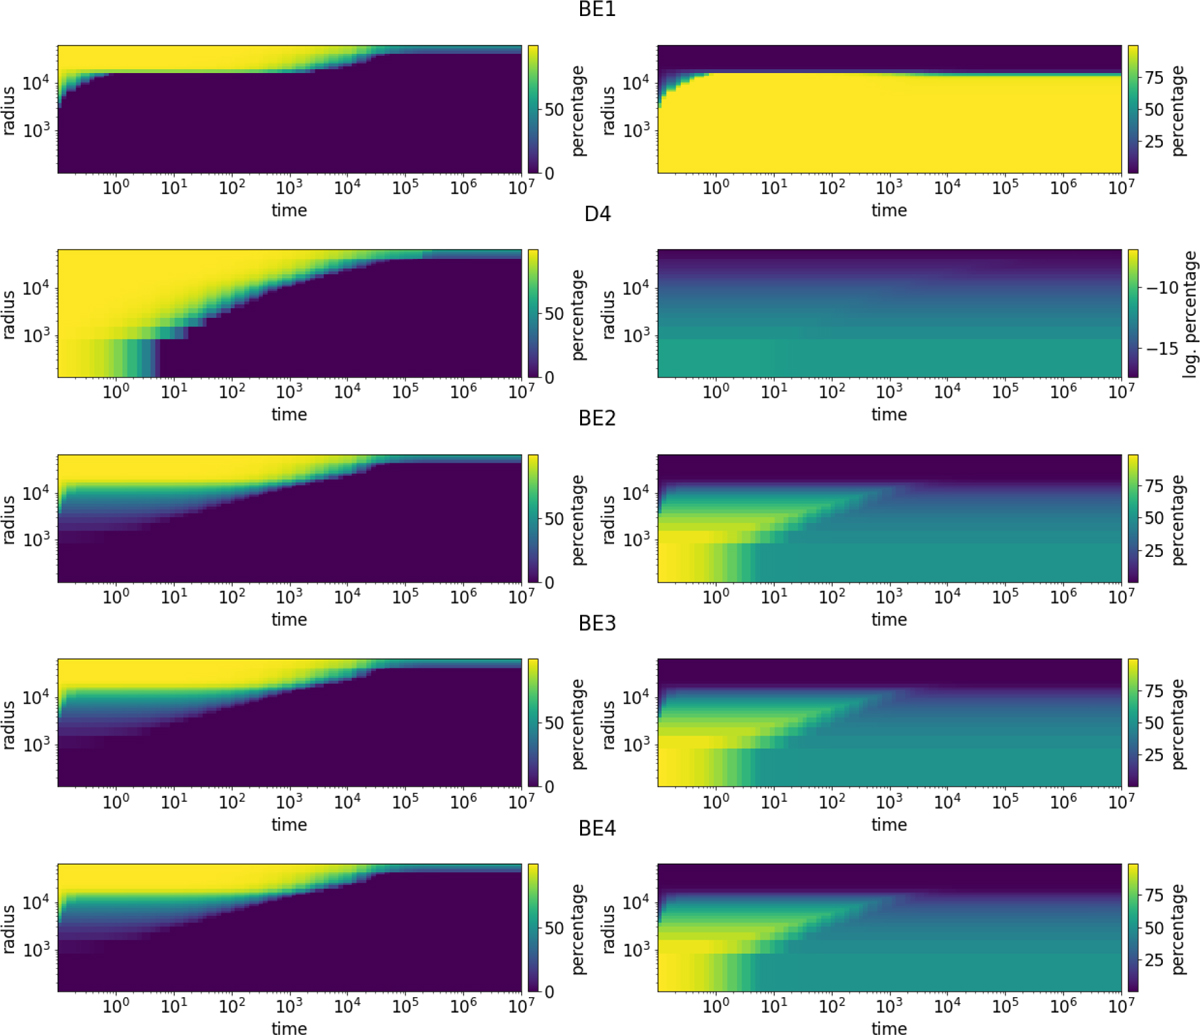
Coverage of dust grain as a function of time (x-axis) and radius (y-axis). The left column shows the percentage of empty binding sites, which are typically filled quickly by absorbed and newly formed molecules. The right column shows the percentage of H2.
Current usage metrics show cumulative count of Article Views (full-text article views including HTML views, PDF and ePub downloads, according to the available data) and Abstracts Views on Vision4Press platform.
Data correspond to usage on the plateform after 2015. The current usage metrics is available 48-96 hours after online publication and is updated daily on week days.
Initial download of the metrics may take a while.