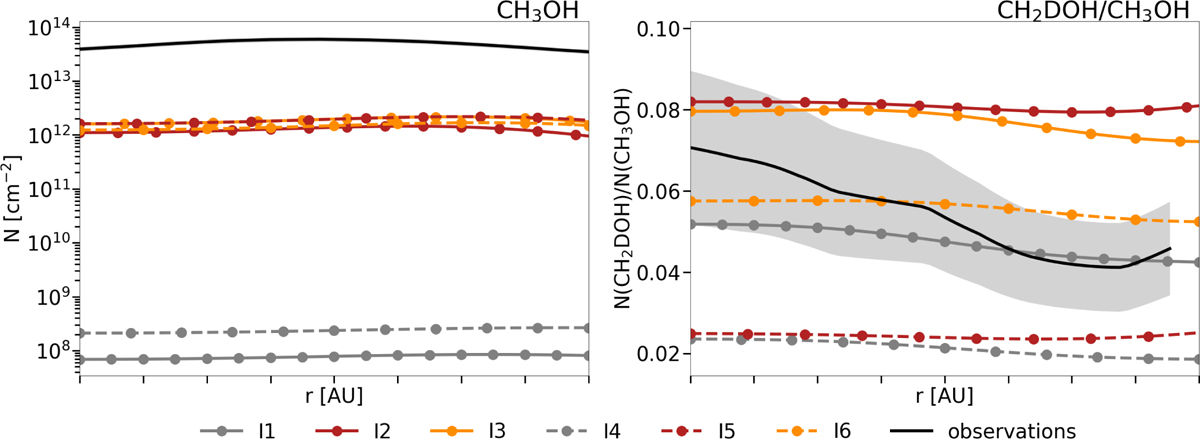
Fig. A.1
Download original image
Modelled column density profiles. Comparison of the main models presented in Riedel et al. (2023) (solid lines) with a respective version of those models with a scaling factor of 0.1 applied to the binding energy of H2 and its deuterated isotopologues (dashed lines). The results are presented for the best-fit time of t = 3.0 × 10⁵ yr. The observed profiles, presented first in Chacón-Tanarro et al. (2019), are depicted in black (errors as grey-shaded areas).
Current usage metrics show cumulative count of Article Views (full-text article views including HTML views, PDF and ePub downloads, according to the available data) and Abstracts Views on Vision4Press platform.
Data correspond to usage on the plateform after 2015. The current usage metrics is available 48-96 hours after online publication and is updated daily on week days.
Initial download of the metrics may take a while.