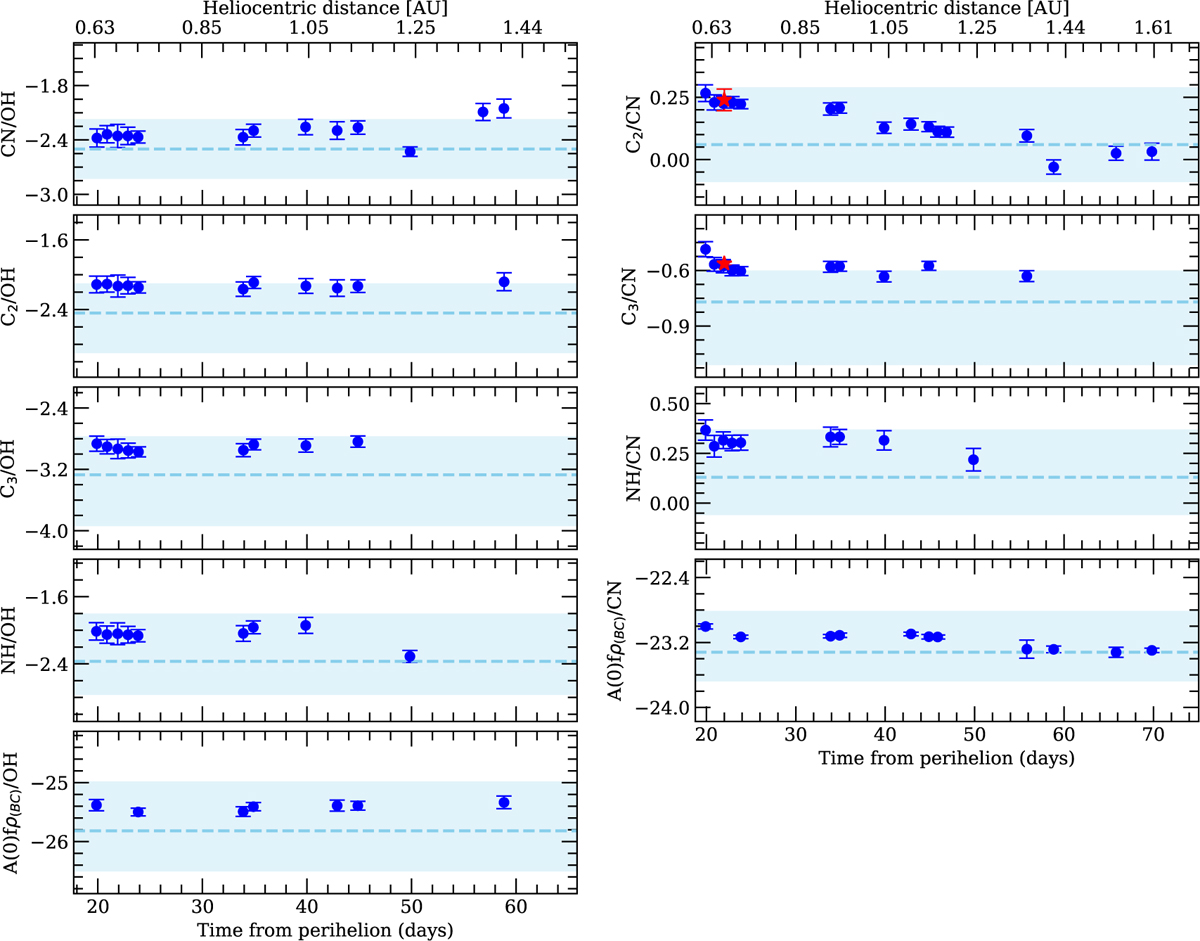
Fig. 10
Download original image
Logarithm of the production rates and dust-to-gas ratios of C/2020 F3 with respect to CN and to OH as a function of time and heliocentric distance. The horizontal dashed blue line and the shaded region represent the mean ratios and range of ratios for comets with typical carbon composition as defined by A’Hearn et al. (1995). The red mark in a few panels represents the corresponding measurements from the spectroscopic observation. The error bars correspond to the 1σ absolute errors.
Current usage metrics show cumulative count of Article Views (full-text article views including HTML views, PDF and ePub downloads, according to the available data) and Abstracts Views on Vision4Press platform.
Data correspond to usage on the plateform after 2015. The current usage metrics is available 48-96 hours after online publication and is updated daily on week days.
Initial download of the metrics may take a while.