Fig. 15
Download original image
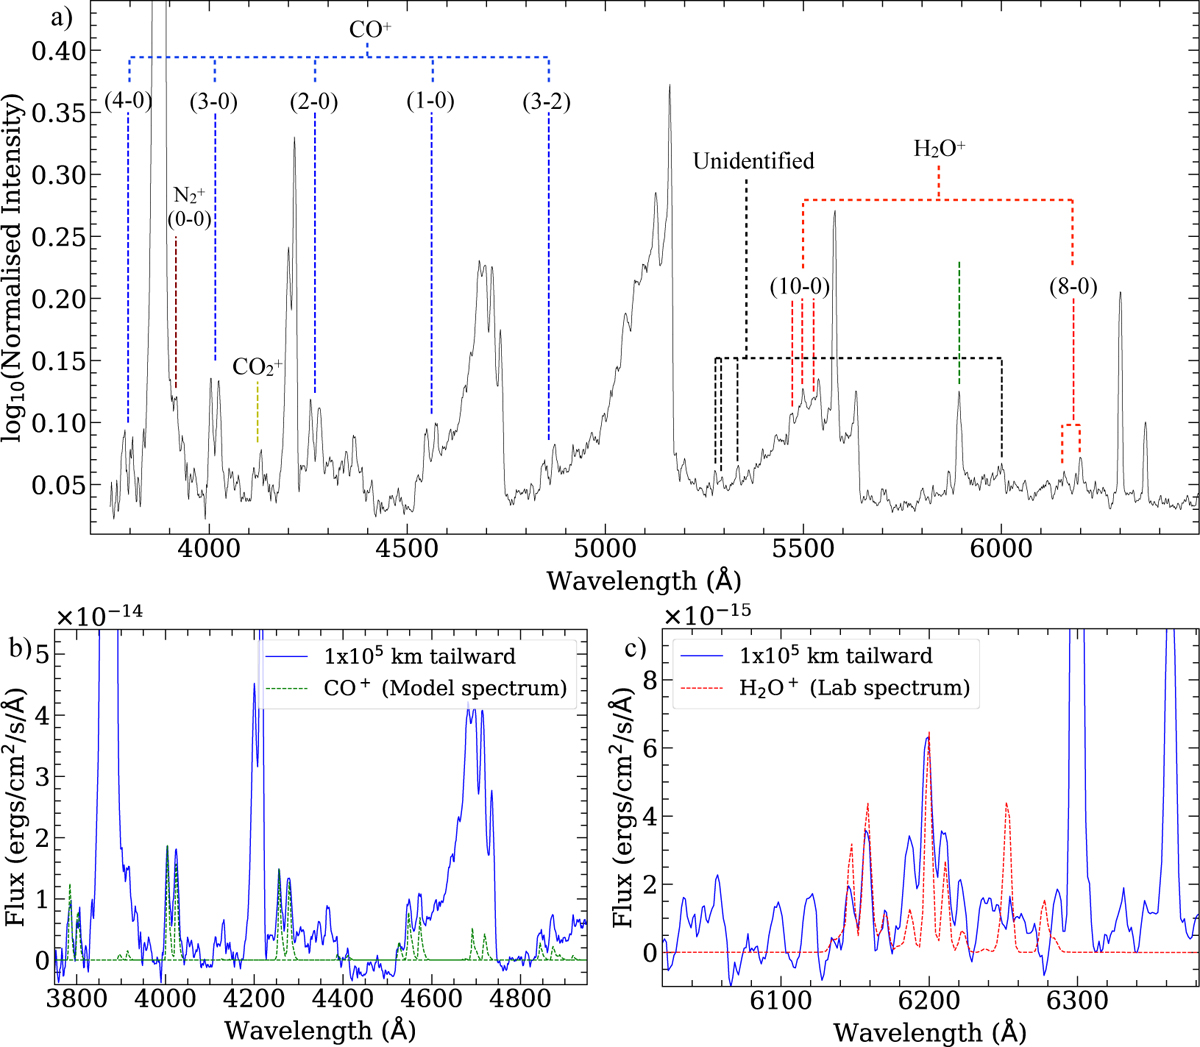
Spectrum of 20F3 extracted from the tailward direction, 1 × 10⁵ km away from the photocentre (a) depicting the detection of ionic emission and a few unidentified emissions; (b) overplotted with the modelled spectrum of CO+ (Rousselot et al. 2024) convolved with the instrument profile, and (c) overplotted with the laboratory spectra of H2O+ (Lew 1976) convolved with the instrument profile.
Current usage metrics show cumulative count of Article Views (full-text article views including HTML views, PDF and ePub downloads, according to the available data) and Abstracts Views on Vision4Press platform.
Data correspond to usage on the plateform after 2015. The current usage metrics is available 48-96 hours after online publication and is updated daily on week days.
Initial download of the metrics may take a while.