Open Access
Fig. 3
Download original image
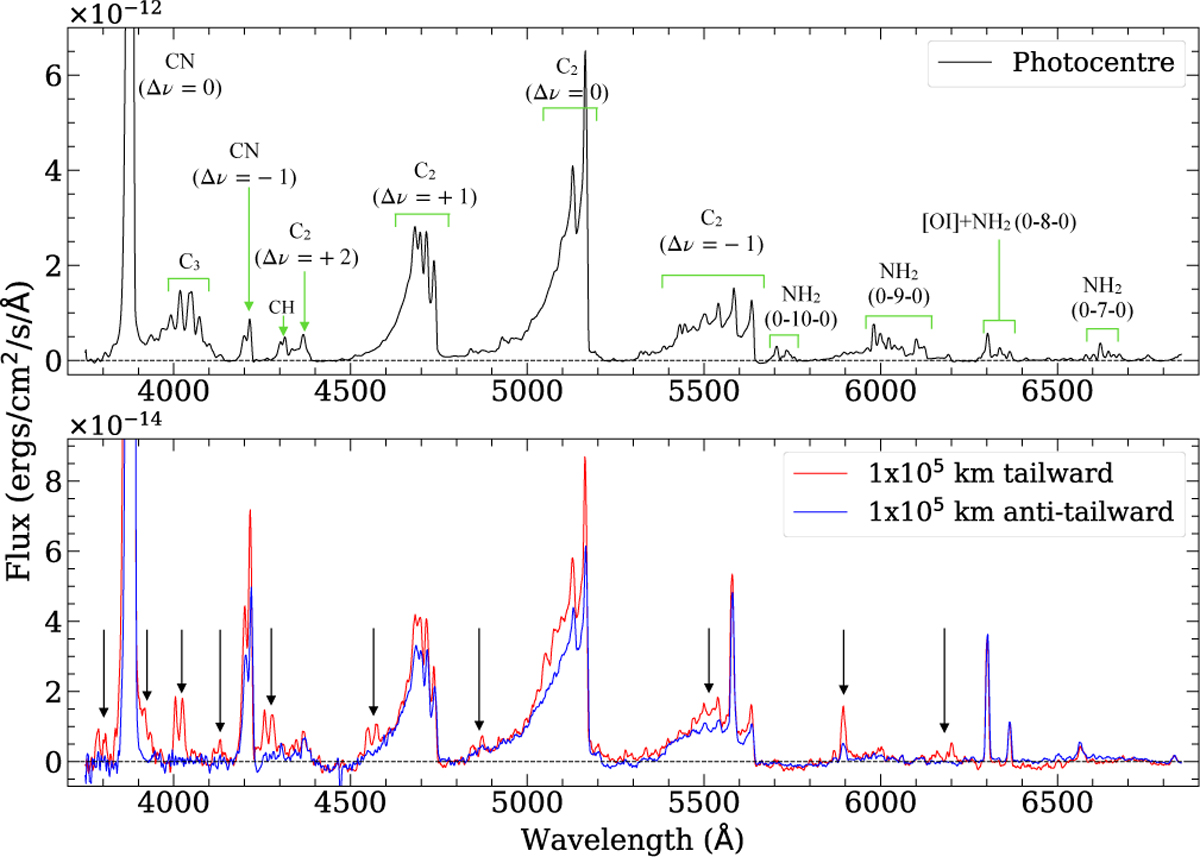
Long-slit spectra of 20F3 observed on 24 July 2020, extracted at photocentre (top panel) and at the extreme regions of the slits in the tailward and anti-tailward directions (bottom panel). The arrows depict the dissimilarity regions for spectra extracted from extreme regions of the slit.
Current usage metrics show cumulative count of Article Views (full-text article views including HTML views, PDF and ePub downloads, according to the available data) and Abstracts Views on Vision4Press platform.
Data correspond to usage on the plateform after 2015. The current usage metrics is available 48-96 hours after online publication and is updated daily on week days.
Initial download of the metrics may take a while.