Open Access
Fig. 7
Download original image
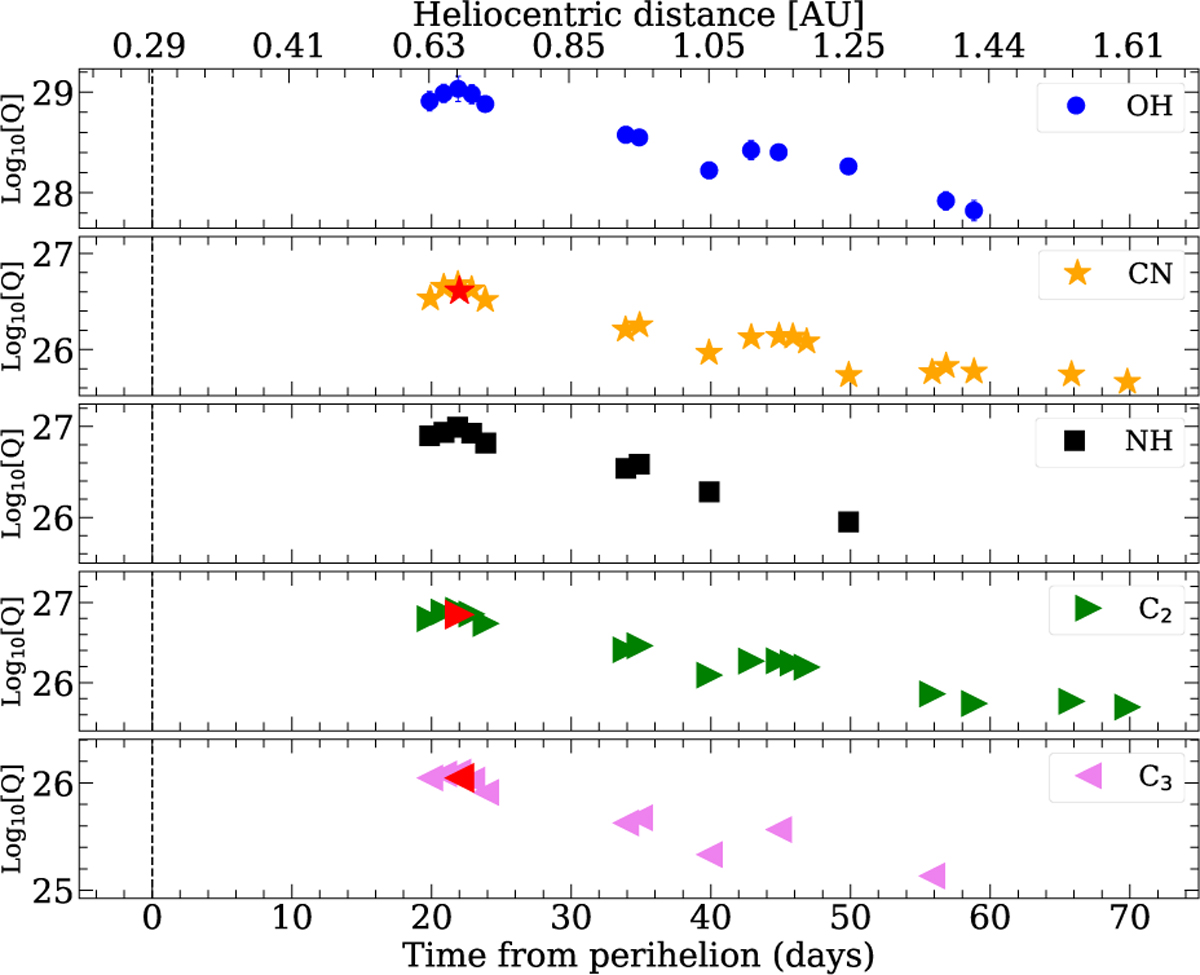
Logarithmic production rates of OH, NH, CN, C3, and C2 detected in 20F3 as a function of time and heliocentric distance. The vertical dashed line indicates the perihelion on 3 July 2020, at 0.29 au. The red mark in each symbol represents the corresponding measurements from the spectroscopic observation.
Current usage metrics show cumulative count of Article Views (full-text article views including HTML views, PDF and ePub downloads, according to the available data) and Abstracts Views on Vision4Press platform.
Data correspond to usage on the plateform after 2015. The current usage metrics is available 48-96 hours after online publication and is updated daily on week days.
Initial download of the metrics may take a while.