Fig. 5
Download original image
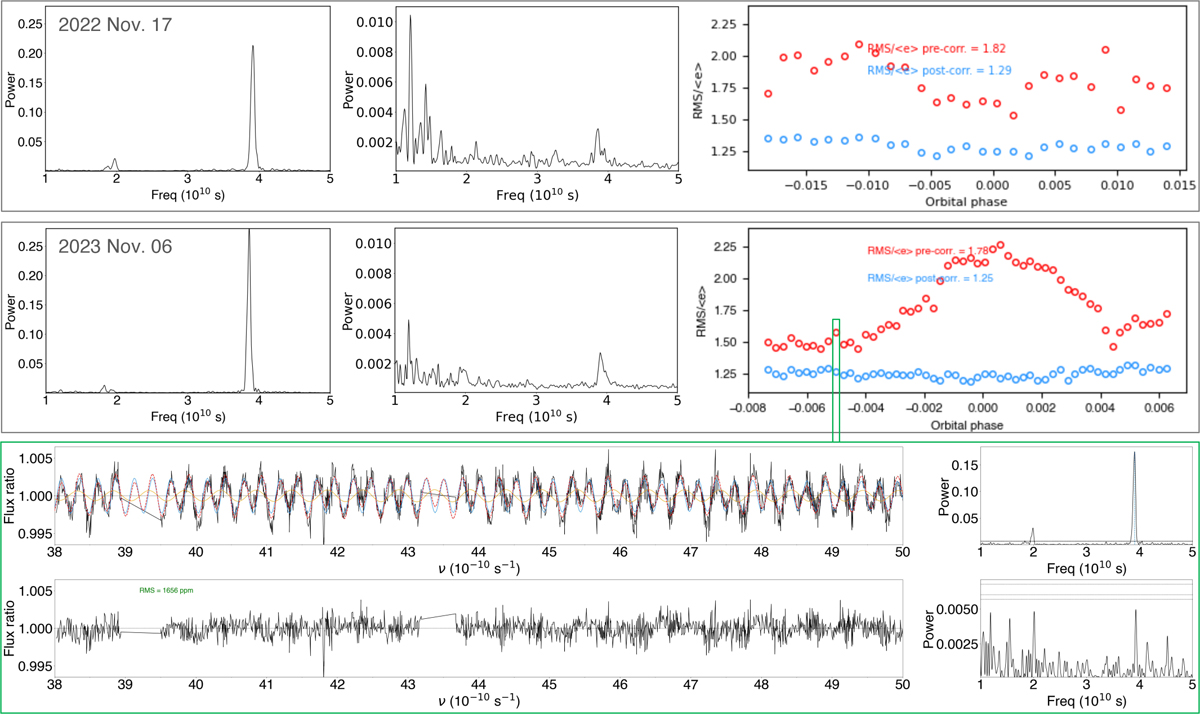
ESPRESSO wiggle correction. Top panels: periodogram cumulated over all transmission spectra before (left) and after (middle) correction. Right panels show the ratio between the RMS of the transmission spectra and their median error before (red) and after (blue) correction. Bottom panel: example transmission spectrum as a function of light frequency, before (top, overplotted with the best-fit wiggle model in red with its dominant blue and secondary orange components) and after (bottom) correction.
Current usage metrics show cumulative count of Article Views (full-text article views including HTML views, PDF and ePub downloads, according to the available data) and Abstracts Views on Vision4Press platform.
Data correspond to usage on the plateform after 2015. The current usage metrics is available 48-96 hours after online publication and is updated daily on week days.
Initial download of the metrics may take a while.