Fig. 1.
Download original image
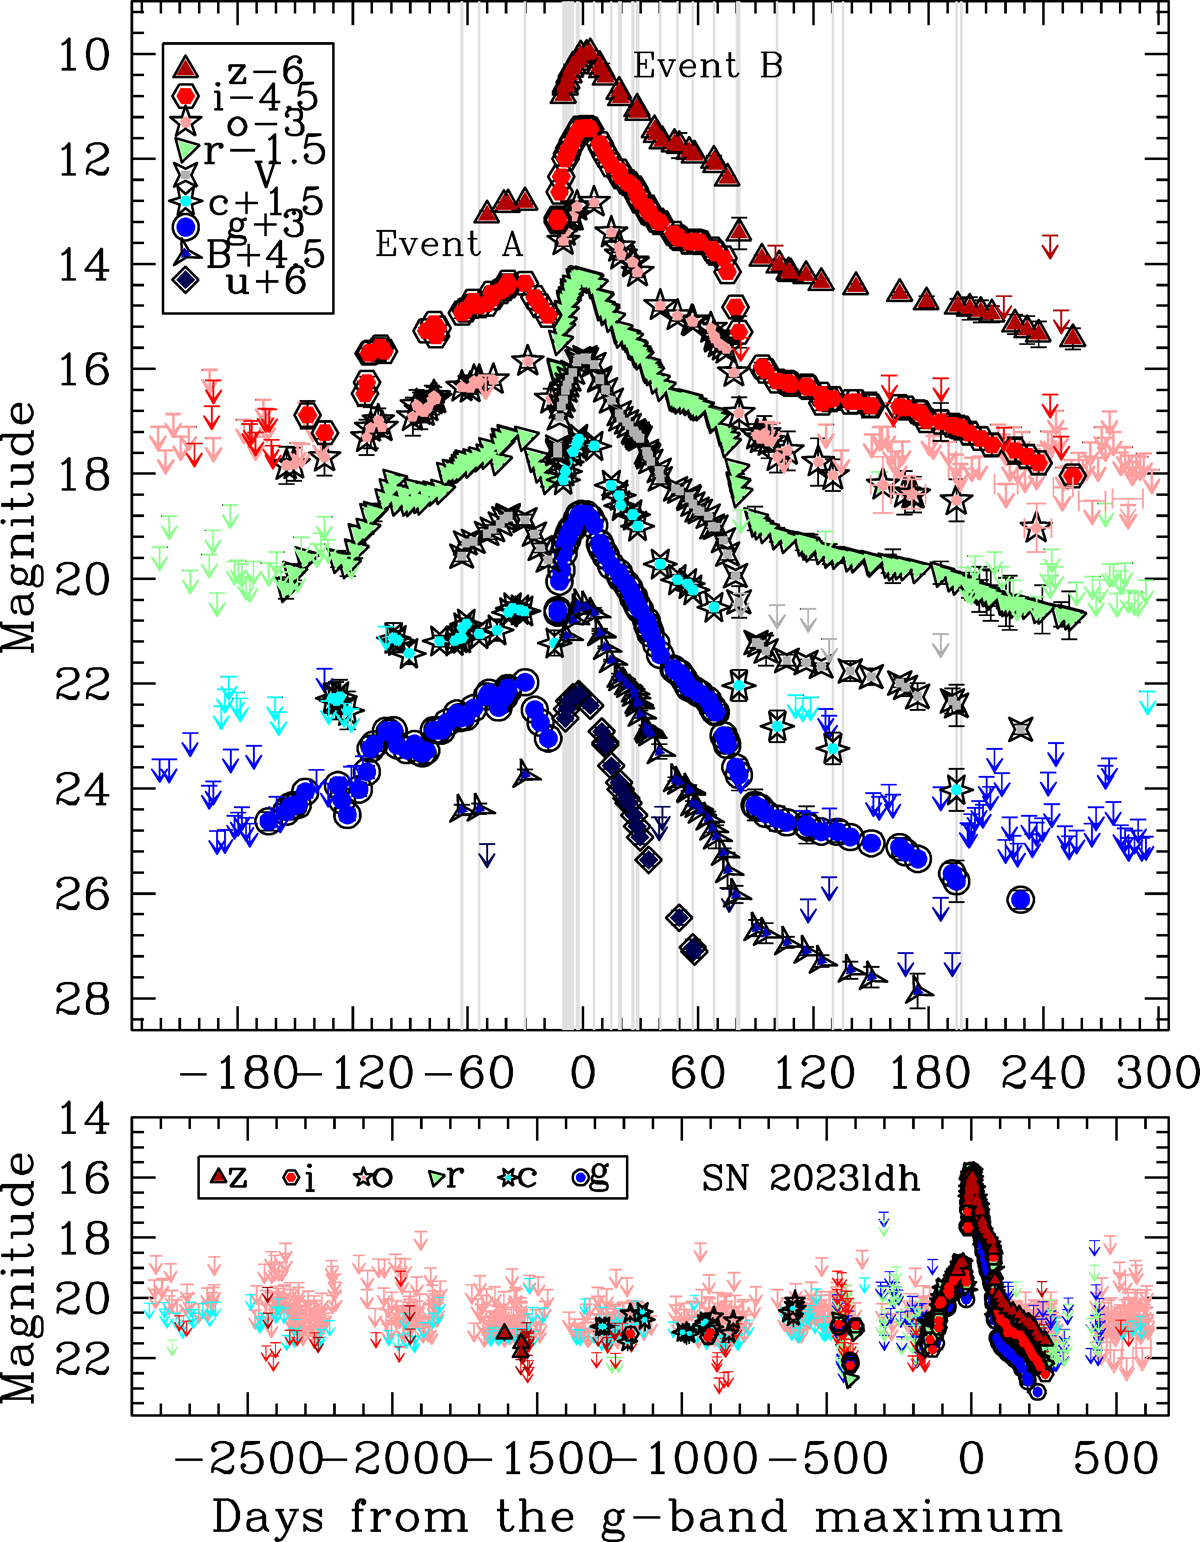
Observed multi-band light curves of SN 2023ldh. Top panel: Blown-up view of the light curve containing the two main brightening episodes: Event A and Event B. Vertical thin grey lines mark the epochs of the spectroscopic observations. Bottom panel: Light curves of SN 2023ldh in a limited number of filters, spanning a period of about nine years. Johnson-Bessell data are in Vega magnitude scale, while Sloan and ATLAS data are in AB magnitude scale. The phases are computed from the time of the r-band Event B maximum (MJD = 60237.0 ± 0.4).
Current usage metrics show cumulative count of Article Views (full-text article views including HTML views, PDF and ePub downloads, according to the available data) and Abstracts Views on Vision4Press platform.
Data correspond to usage on the plateform after 2015. The current usage metrics is available 48-96 hours after online publication and is updated daily on week days.
Initial download of the metrics may take a while.