| Issue |
A&A
Volume 701, September 2025
|
|
|---|---|---|
| Article Number | A32 | |
| Number of page(s) | 13 | |
| Section | Stellar structure and evolution | |
| DOI | https://doi.org/10.1051/0004-6361/202554858 | |
| Published online | 02 September 2025 | |
A long-lasting eruption heralds SN 2023ldh, a clone of SN 2009ip
1
INAF – Osservatorio Astronomico di Padova, Vicolo dell’Osservatorio 5, I-35122 Padova, Italy
2
INAF – Osservatorio Astronomico di Brera, Via E. Bianchi 46, I-23807 Merate, Italy
3
INAF – Osservatorio Astronomico d’Abruzzo, Via Mentore Maggini, I-64100 Teramo, Italy
4
Yunnan Observatories, Chinese Academy of Sciences, Kunming 650216, PR China
5
Key Laboratory for the Structure and Evolution of Celestial Objects, Chinese Academy of Sciences Kunming 650216, PR China
6
International Centre of Supernovae, Yunnan Key Laboratory, Kunming 650216, PR China
7
Department of Physics and Astronomy, University of Turku, Vesilinnantie 5, FI-20014 Turku, Finland
8
Department of Physics and Astronomy, University of California, 1 Shields Avenue, Davis, CA 95616-5270, USA
9
Center for Astrophysics | Harvard & Smithsonian, 60 Garden Street, Cambridge, MA 02138-1516, USA
10
Institute of Space Sciences (ICE, CSIC), Campus UAB, Carrer de Can Magrans s/n, E-08193 Barcelona, Spain
11
Las Cumbres Observatory, 6740 Cortona Dr #102, Goleta, CA 93117, USA
12
Department of Physics, University of California, Santa Barbara, Santa Barbara, CA 93106, USA
13
Università degli Studi di Padova, Dipartimento di Fisica e Astronomia, Vicolo dell’Osservatorio 2, 35122 Padova, Italy
14
Science and Technology Department, Parthenope University of Naples, Centro Direzionale, Isola C4, I-80143 Naples, Italy
15
School of Physics, O’Brien Centre for Science North, University College Dublin, Belfield, Dublin 4, Ireland
16
Istitut d’Estudis Espacials de Catalunya (IEEC), E-08860 Castelldefels (Barcelona), Spain
17
The NSF AI Institute for Artificial Intelligence and Fundamental Interactions, USA
18
Finnish Centre for Astronomy with ESO (FINCA), University of Turku, 20014 Turku, Finland
19
Astrophysics Research Institute, Liverpool John Moores University, IC2, 146 Brownlow Hill, Liverpool L3 5RF, UK
20
Max Planck Institute for Astrophysics, Karl-Schwarzschild-Str. 1, 85741 Garching, Germany
21
INAF – Osservatorio Astronomico di Roma, Via Frascati 33, I-00078 Monte Porzio Catone, Italy
22
Johns Hopkins University, 3400 N. Charles Street, Baltimore, MD 21218, USA
23
INAF-Osservatorio Astronomico di Capodimonte, Via Moiariello 16, 80131 Napoli, Italy
24
Dipartimento di Fisica, Università degli Studi di Milano, Via Celoria 16, I-20133 Milano, Italy
25
INAF – IASF Milano, Via A. Corti 12, I-20133 Milano, Italy
26
Technical University of Munich, TUM School of Natural Sciences, Physics Department, James-Franck-Str. 1, 85741 Garching, Germany
27
Department of Physics, University of Oxford, Denys Wikinson Building, Kable Road, Oxford OX1 3RH, UK
28
Astrophysics Research Centre, School of Mathematics and Physics, Queen’s University Belfast, Belfast BT7 1NN, UK
29
Department of Physics and Astronomy, Aarhus University, Ny Munkegade 120, 8000 Aarhus C, Denmark
30
Adler Planetarium, 1300 S. DuSable Lake Shore Drive, Chicago, IL 60605, USA
31
School of Physics and Astronomy, Beijing Normal University, Beijing 100875, China
32
Department of Physics, Faculty of Arts and Sciences, Beijing Normal University, Zhuhai 519087, China
33
Università degli Studi dell’Insubria, Dipartimento di Scienza e Alta Tecnologia, Via Valeggio 11, I-22100 Como, Italy
34
Itagaki Astronomical Observatory, Yamagata 990-2492, Japan
35
Variable Star Observers League in Japan, 7-1 Kitahatsutomi, Kamagaya, Chiba 273-0126, Japan
36
The Oskar Klein Centre, Department of Astronomy, Stockholm University, AlbaNova, SE-10691 Stockholm, Sweden
37
Institute for Astronomy, University of Hawaii, 2680 Woodlawn Drive, Honolulu, HI 96822, USA
⋆ Corresponding author: This email address is being protected from spambots. You need JavaScript enabled to view it.
Received:
29
March
2025
Accepted:
4
July
2025
Abstract
We discuss the results of the spectroscopic and photometric monitoring of the type IIn supernova (SN) 2023ldh. Survey archive data show that the SN progenitor experienced erratic variability in the years before exploding. Beginning May 2023, the source showed a general slow luminosity rise that lasted for over four months, with some superposed luminosity fluctuations. In analogy to SN 2009ip, we call this brightening ‘Event A’. During Event A, SN 2023ldh reached a maximum absolute magnitude of Mr = −15.52 ± 0.24 mag. The light curves then decreased by about 1 mag in all filters for about two weeks reaching a relative minimum, which was followed by a steep brightening (Event B) to an absolute peak magnitude of Mr = −18.53 ± 0.23 mag, replicating the evolution of SN 2009ip and similar to that of type IIn SNe. The three spectra of SN 2023ldh obtained during Event A show multi-component P Cygni profiles of H I and Fe II lines. During the rise to the Event B peak, the spectrum shows a blue continuum dominated by Balmer lines in emission with Lorentzian profiles, with a full width at half maximum velocity of about 650 km s−1. Later, in the post-peak phase, the spectrum reddens, and broader wings appear in the Hα line profile. Metal lines with P Cygni profiles and velocities of about 2000 km s−1 are clearly visible. Beginning around three months past maximum and until very late phases, the Ca II lines become among the most prominent features, while Hα is dominated by an intermediate-width component with a boxy profile. Although SN 2023ldh mimics the evolution of other SN 2009ip-like transients, it is slightly more luminous and has a slower photometric evolution. The surprisingly homogeneous observational properties of SN 2009ip-like events may indicate similar explosion scenarios and similar progenitor parameters.
Key words: stars: winds / outflows / supernovae: individual: SN 2023ldh / supernovae: individual: SN 2009ip
© The Authors 2025
 Open Access article, published by EDP Sciences, under the terms of the Creative Commons Attribution License (https://creativecommons.org/licenses/by/4.0), which permits unrestricted use, distribution, and reproduction in any medium, provided the original work is properly cited.
This article is published in open access under the Subscribe to Open model. This email address is being protected from spambots. You need JavaScript enabled to view it. to support open access publication.
1. Introduction
The latest stages of life of massive stars are poorly known, and, in some cases, observations seem to contradict theoretical predictions. Unequivocal observational evidence indicates that a massive star can experience recurrent short-duration outbursts, or even longer-lasting eruptive phases, a short time before finally exploding as a supernova (SN; for a review, see Smith 2014). In particular, clear signatures of pre-SN variability are frequently observed in the progenitors of SNe that interact with circumstellar material (CSM). Although major outbursts are frequently observed in association with H-rich progenitors of type IIn SNe (e.g. Ofek et al. 2014; Strotjohann et al. 2021; Reguitti et al. 2024, and references therein), pre-SN variability in H-poor, He-rich progenitors of type Ibn SNe is only occasionally observed (e.g. Pastorello et al. 2007; Brennan et al. 2024).
Spectroscopic monitoring of the pre-SN eruptive phase is available for a handful of type IIn SNe: SN 2009ip (Smith et al. 2010; Foley et al. 2011; Pastorello et al. 2013; Mauerhan et al. 2013), SN 2015bh (Elias-Rosa et al. 2016; Thöne et al. 2017), and SN 2016jbu (Kilpatrick et al. 2017; Brennan et al. 2022a). More recently, pre-SN spectra were also obtained for the type Ibn SN 2023fyq (Brennan et al. 2024; Dong et al. 2024). The combination of photometric monitoring and spectroscopic observations obtained before the stellar core collapse is fundamental for the characterisation of the progenitor star. For this reason, it is crucial to obtain spectral sequences for all species of transients in the luminosity gap that separates classical novae and core-collapse SNe (Kasliwal 2012; Pastorello & Fraser 2019; Cai et al. 2022), as a fraction of them have been seen to explode as a SN a short time later. In this paper we discuss the case of an object initially identified as a long-lasting gap transient that later experienced a major brightening compatible with a type IIn SN explosion: SN 2023ldh. A combination of long-lasting photometric monitoring and spectra from the pre-SN eruptive phase to the late nebular phase makes SN 2023ldh one of the interacting SNe with the most comprehensive datasets.
The optical transient SN 2023ldh1 was discovered by the Zwicky Transient Facility (ZTF; Bellm et al. 2019; Graham et al. 2019) on 2023 May 28.32 UT, at a g-band magnitude of 20.74 (De 2023). The coordinates are RA = 15:09:09.597 and Dec = +52:31:59.80 (J2000),  west and
  north of the centre of the spiral galaxy (SAb-type) NGC 5875. The location of SN 2023ldh is nearly coincident with an extended source, SDSS J150909.51+523159.0, and is also very close (about 0.2 arcmin) to the explosion site of the Ca-rich transient SN 2022oqm (Sollerman et al. 2022; Zimmerman et al. 2022; Fulton et al. 2022; Irani et al. 2024; Yadavalli et al. 2024). The closest source within NGC 5875 with a known redshift (z = 0.011321 ± 0.000016) is SDSS J150912.08+523154.3, only ∼0.39 arcmin south-east of SN 2023ldh. Later, on 2023 October 13.46 UT, K. Itagaki announced a brightening of the source to an unfiltered magnitude of 16, and a low signal-to-noise spectrum was obtained with the 1.82 m Copernico Telescope of the Asiago Observatory (Italy), allowing us to classify the object as a type IIn SN (Pastorello et al. 2023).
The distance of the host galaxy was estimated using the Tully-Fisher method. We adopted the most recent estimate of Tully et al. (2013), who reported the following cosmological parameters: the Hubble constant H0 = 73 km s−1 Mpc−1, Ωmatter = 0.27, and Ωvacuum = 0.73. From a host galaxy distance of 54.5 ± 5.0 Mpc, we infer a distance modulus of μ = 33.68 ± 0.20 mag2.
The interstellar dust reddening towards SN 2023ldh is composed of a modest Milky Way contribution plus a significant component from within the host galaxy. We can infer the former component from Schlafly & Finkbeiner (2011), E(B − V)MW = 0.016 mag, and the latter can be obtained through the analysis of our highest-resolution spectrum of the SN (see Sect. 4.1 for a discussion on the method). Including the host galaxy contribution, we infer a total colour excess of E(B − V)tot = 0.216 ± 0.044 mag in the direction of SN 2023ldh. This value is used throughout the paper.
2. Observations
A short time after the discovery announcement of SN 2023ldh, we initiated a monitoring campaign aimed to study the evolution of the transient in the context of the Nordic Optical Telescope (NOT) Unbiased Transient Survey-2 (NUTS-2) programme3. For the photometric campaign, we made use of the following facilities: the 2 m Liverpool Telescope (LT) equipped with IO:O, the 2.56 m Nordic Optical Telescope (NOT) with the Alhambra Faint Object Spectrograph and Camera (ALFOSC), the 10.4 m Gran Telescopio Canarias (GTC) with the Optical System for Imaging and low-Intermediate-Resolution Integrated Spectroscopy (OSIRIS+), hosted in La Palma (Spain); the 1.82 m Copernico Telescope with the Asiago Faint Object Spectrograph and Camera (AFOSC) and the 67/91 cm Schmidt Telescope with a Moravian detector, hosted at the Asiago Observatory, Mt. Ekar (Italy); the Wide-field Optical Telescope (WOT), a 68/91 cm Schmidt Telescope equipped with an Apogee Aspen CCD, at the Campo Imperatore Observatory (Italy); the Joan Oró Telescope (TJO) with MEIA2 at the Montsec Astronomical Observatory (Spain); the 1m-class telescopes of Las Cumbres Observatory (LCO) telescope network4 equipped with Sinistro cameras in the framework of the Global Supernova Project. Additional data were collected through 0.5 m class amateur facilities of the iTelescope network5 hosted in Utah and California (USA), and others were obtained at Itagaki Observatory of Yamagata (Japan). Crucial pre-SN data were finally collected from the public surveys, including ZTF6 (in the g and r bands), ATLAS7 (with the cyan and orange filters – hereafter c and o; Tonry et al. 2018; Smith et al. 2020), and Pan-STARRS (in the r, i, and z bands; Chambers et al. 2016; Flewelling et al. 2020; Magnier et al. 2020). Including the survey data, the photometric data analysed in this paper cover a period of about nine years, from 2016 to early 2025.
We also collected about 30 optical spectra (see Sect. 4), spanning a period of about 260 days. The spectra were obtained using GTC with OSIRIS+, the NOT with ALFOSC, the Copernico Telescope with AFOSC, the 3.58 m Telescopio Nazionale Galileo at La Palma (Spain) equipped with Dolores (LRS), the 6.5 m MMT telescope (Mount Hopkins, Arizona, USA) equipped with the Binospec spectrograph, and the 10 m Keck I telescope with the Low Resolution Imaging Spectrometer (LRIS).
3. Photometric data
Photometric observations of SN 2023ldh were obtained with the following filters: Johnson-Bessell B and V; Sloan u, g, r, i, and z; ATLAS o and c. While the ATLAS and Pan-STARRS magnitudes were directly collected through the survey data release interfaces (see Sect. 2), the reduction of ZTF data and the images obtained with our facilities was carried out using the SNOOPY pipeline8. After correcting the science frames for bias and flat-field images, we fine-tuned the astrometric calibration of the images and measured the instrumental point-spread-function-fitting photometry of the target after the subtraction of the host galaxy template9. The final photometric calibration was performed accounting for the zero point and colour-term corrections for each instrumental configuration, and making use of secondary standards from the Sloan Digital Sky Survey (SDSS; Almeida et al. 2023) catalogue. To calibrate the photometric data in the Johnson-Cousins filters, a catalogue of comparison stars was obtained by converting Sloan magnitudes to Johnson-Cousins magnitudes using the transformation relations of Chonis & Gaskell (2008).
3.1. Light curve evolution
The multi-band optical light curves, from −230 d to about +300 d with respect to the maximum epoch of Event B, are shown in Fig. 1 (top panel). All photometric data are reported in Table A.110. Observations obtained by the surveys mentioned above since 2016 are also available, and are shown in the bottom panel of Fig. 1 for a limited number of filters.
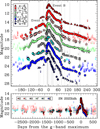 |
Fig. 1. Observed multi-band light curves of SN 2023ldh. Top panel: Blown-up view of the light curve containing the two main brightening episodes: Event A and Event B. Vertical thin grey lines mark the epochs of the spectroscopic observations. Bottom panel: Light curves of SN 2023ldh in a limited number of filters, spanning a period of about nine years. Johnson-Bessell data are in Vega magnitude scale, while Sloan and ATLAS data are in AB magnitude scale. The phases are computed from the time of the r-band Event B maximum (MJD = 60237.0 ± 0.4). |
Earlier observations, obtained from mid-2016 by the main surveys or through the inspection of the public archives, show no sources to a limiting magnitude of about 22 in the r band (see Table A.1). Subsequent observations return in most cases detection limits, although a faint source is detected (≳3σ) in the SN location at several epochs. In particular, the source is visible in z-band Pan-STARRS images obtained in mid-2019 (from May 20 to July 18), at magnitudes ranging from z ∼ 21.2 to 21.8 mag. In i-band Pan-STARRS and c, o ATLAS images taken from April to September 2020 and from January to July 2021, the object is seen always at magnitudes fainter than 20.5 mag. In January and February 2022 the source is still detected in ATLAS images at slightly brighter magnitudes (c ∼ o ≈ 20.4 ± 0.2 mag). The source is also found in archival LCOGT g, r, i images obtained in mid-2022 (on July 18, August 27, and September 13) with magnitudes varying erratically in the three filters (from 20.7 to 22.7 mag in the r band). These luminosity fluctuations are produced by the same stellar system that will later generate SN 2023ldh, and are similar to the extreme variability expected in massive binaries containing luminous blue variables (e.g. Wagner et al. 2004; Pastorello et al. 2010; Müller et al. 2023; Aghakhanloo et al. 2023a,b; Pustilnik & Perepelitsyna 2025).
The transient is observed again from 2023 May 9, about 20 days before the official discovery date (De 2023). In this phase, the light curve of the transient shows a slow increase in luminosity (by about 2.5−3 magnitudes) in all optical filters lasting about four months. Significant luminosity fluctuations are observed superimposed on the global luminosity rise, in particular at about 1.5 months after the discovery. The average rise rates are −1.9 ± 0.1 mag (100 d)−1 in the g band, −2.3 ± 0.1 mag (100 d)−1 in the r band, and −2.2 ± 0.1 mag (100 d)−1 in the i band. The epoch and the magnitude of the r-band light-curve maximum (MJD = 60200.6 ± 1.7 and r = 18.75 ± 0.06 mag, respectively) are determined through a low-order polynomial fit. This first peak is reached about four months after the discovery, at a similar time for all filters (see Table 1). Accounting for the line-of-sight extinction and the adopted host galaxy distance, we obtain the following absolute magnitude at the time of this first light-curve peak: Mr = −15.52 ± 0.24 mag11. Following the notation introduced by Pastorello et al. (2013), we call this early peak ‘Event A’. We note a moderately blue colour at the time of the Event A maximum, g − r ∼ 0.10 mag.
Timing (MJDs) and apparent and absolute magnitudes at maximum in the different bands, as obtained from fitting the light curve with a low-order polynomial.
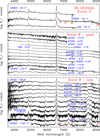 |
Fig. 2. Sequence of optical spectra of SN 2023ldh obtained during Event A (top panel), around the maximum of Event B (middle panel), and at phases later than about four weeks from the Event B peak (bottom panel). The spectra are corrected for the redshift (z = 0.011321) of the nearby source known as SDSS J150912.08+523154.3. |
Then, the light curves decline for about three weeks, until MJD = 60221.3 ± 2.5, to finally rise again, much more rapidly than before. SN 2023ldh reaches the r-band peak of the so-called Event B on MJD = 60237.0 ± 0.4 (r = 15.74 ± 0.02 mag, i.e. Mr = −18.53 ± 0.23 mag). At this second maximum, the colour is even bluer, g − r ∼ −0.22 mag. As usually happens in SNe, the light-curve peak is reached earlier in the blue bands than in the redder bands. The epochs, the apparent and the absolute magnitudes at the maximum of Event B are reported in Table 1 for all filters. The maximum is followed by an initial rapid decline lasting approximately 40 days, with a decline rate of γr = 5.2 ± 0.1 mag (100 d)−1 in the r-band light curve. The decline rate is much faster in the blue than in the red bands12. From about +40 to +70 d, the light curves show a short-lasting plateau, more evident in the red bands (γr = 1.6 ± 0.1 mag (100 d)−1), followed by a rapid decline lasting about 3 weeks. From phase ∼ 100 to 200 d, the decline rate in the r band is γr = 0.85 ± 0.03 mag (100 d)−113, which is surprisingly similar to that expected from the radioactive decay of 56Co into 56Fe (see the discussion in Sect. 5).
At phases later than ∼200 d, a moderate steepening is observed in the optical light curves. For a 56Co-powered SN light curve, this is usually interpreted as a consequence of an enhanced γ-rays escape with the expansion of the ejecta. However, while an incomplete trapping produces a light curve with a faster decline than the one expected from the 56Co decay, its slope is not expected to change over time. Alternatively, we can invoke an attenuated contribution of the ejecta-CSM interaction at late times as the shock front reaches the outermost CSM regions. The increased rate of the luminosity decline may also be interpreted as evidence of the ‘snow-plow’ phase described by Svirski et al. (2012), which may occur when the mass gathered by the forward shock is comparable to the mass of the ejecta. Under this regime, we expect a gradual change in the slope of the bolometric light curve proportional to t−1.5 (see also the discussion in Moriya et al. 2013). Finally, an increased decline rate at late phases can also be interpreted as evidence of dust formation, although infrared observations are not available to support this scenario.
4. Spectroscopy
Our spectra span the evolution of the transient from about 2 months before to about 200 d after the Event B maximum. Basic information on the spectra is reported in Table 2. The NOT/ALFOSC, Copernico/AFOSC and GTC spectra were reduced using the FOSCGUI pipeline14. The LRIS spectrum was reduced using the IDL LPIPE package (Perley 2019), while spectra obtained with other instruments were reduced using standard routines in the IRAF environment. Regardless of the package used, the reduction steps for all instruments included bias subtraction, flat-field correction, optimal extraction of the 1D spectrum, wavelength and flux calibrations, and telluric band corrections. The spectral fluxing was then checked with coeval photometry and, when necessary, a constant correction factor wasapplied.
Spectroscopic observations of SN 2023ldh.
4.1. Line-of-sight reddening
To estimate the total reddening in the direction of SN 2023ldh introduced in Sect. 1, we used the highest resolution GTC spectrum of the SN obtained −7 d from the maximum light (see Table 2) to estimate the reddening contribution of the host galaxy through the relation between the equivalent width (EW) of the narrow interstellar Na I 5889, 5895 Å doublet (hereafter Na ID) and the colour excess due to line-of-sight dust (Poznanski et al. 2012)15. Following the notation of Poznanski et al. (2012), we measure EW(D1) = 0.40 ± 0.03, EW(D2) = 0.64 ± 0.04, and EW(D1 + D2) = 1.13 ± 0.04 Å. Using their Eqs. (7)–(9), we obtain a weighted average colour excess for the host galaxy of E(B − V)host = 0.233 ± 0.050 mag, which has to be scaled by a factor of 0.86, as prescribed by Dastidar et al. (2025). Taking into account the Milky Way reddening towards SN 2023ldh, we obtain E(B − V)tot = 0.216 ± 0.044 mag, which is the value used for the total dust extinction in the direction ofSN 2023ldh.
4.2. Spectral evolution
The spectra of SN 2023ldh were analysed after applying redshift and reddening corrections. The adopted redshift near the SN location is z = 0.011321 (see Sect. 1). To accurately describe the spectroscopic evolution of SN 2023ldh, we identified five main evolutionary phases.
-
Event A – We collected spectra at three epochs during Event A, all of them showing a moderately hot continuum, with a black-body temperature of Tbb ∼ 9200 K. The spectra show prominent lines of the Balmer series along with numerous P Cygni lines of Fe II. Na ID and the near-infrared (NIR) Ca II triplet are also clearly identified. Other metal lines are less conspicuous (e.g. Sc II). The H lines show a composite profile: a narrower component peaking at the rest wavelength of the transition and having a full width at half maximum (FWHM)16 velocity (vFWHM) of about 400 km s−1, an intermediate-width component (slightly redshifted from the rest wavelength) with vFWHM ∼ 2000 − 2500 km s−1, and a broad component (vFWHM ∼ 4500 km s−1) with a peak redshifted by more than 2000 km s−1. We caution, however, that emission lines from background sources may affect the observed line profiles in these low-resolution spectra. The H lines also show a multi-component absorption profile, which is well discernible in the first GTC/OSIRIS+ spectrum (at phase −63.1 d). In particular, in this spectrum Hα shows a broad absorption with the minimum blueshifted by 3760 ± 300 km s−1 and a blue wing extending up to over 4650 km s−1, plus a slower absorption component whose minimum is blueshifted by 2590 ± 80 km s−1. The profile of Hβ is similar to that of Hα, although the measurements are complicated by line blending with P Cygni Fe II features.
-
Rise to Event B maximum – After the Event B onset, on MJD = 60221.3 ± 2.5, the continuum temperature rises and reaches Tbb ∼ 16 000 − 17 000 K a few days before the light-curve maximum, then gradually declines in the post-maximum evolution. We note that the spectral energy distribution (SED) peaks in the ultraviolet domain at these early epochs. Since this region is not covered by our optical spectra, the temperature estimates at the early phases obtained via blackbody fits to the spectral continuum are affected by large errors (typically ±2000−3000 K). During the rise to the Event B peak (which lasts ∼15 days) and up to about three weeks past maximum, the SN spectrum shows very little evolution. It is characterised by a blue continuum with superposed prominent Balmer lines showing a dominant emission component. The line profile is best fitted with a Lorentzian function whose emission core is at the rest wavelength of the transition. The FWHM velocity of the H lines is 650 ± 30 km s−1, as inferred from the best-resolution (∼150 km s−1) GTC/OSIRIS+ spectrum obtained −7.2 d from the maximum light. A residual broad P Cygni absorption is detected at the positions of Hβ and Hγ with a minimum blueshift of about 4000 km s−1 and a blue wing that extends to about 8000−10 000 km s−1. We also detect He I lines (λ4471.5, λ4921.9, λ5015.7, λ5875.6, λ6678.1, λ7065.2), revealing a narrow emission component superposed on a broad P Cygni base. While the FWHM velocity of the emission component is comparable to that of the narrow Balmer lines, He I λ5875.6 shows a clear P Cygni profile, with a minimum at −2780 km s−1 from the rest frame, and a blueshifted wing extending up to about 5000 km s−1. Another emission feature clearly detected in the low-resolution spectra from −6.2 d to −3.2 d from maximum is O I λ8446.5, with vFWHM ∼ 400 − 450 km s−1. Spectra showing a prominent O I λ8446.5 emission line, while O I λλ7772−7775 remains below the detection threshold, are quite frequent in type IIn SNe, such as SN 1995G (Pastorello et al. 2002) and SN 2010jl (Fransson et al. 2014). This feature is likely indicative of Lyβ pumping (see Valerin et al. 2025, for a detailed discussion on the Bowen fluorescence mechanism). Finally, a broad emission bump is observed at 4600−4700 Å, possibly due to a blend of C III, N III, and He II lines.
-
Early post-maximum decline (phases from 0 d to +30 d) – At this phase, the spectrum shows a modest evolution, with a continuum becoming progressively redder. The He I lines become weaker, the absorption components of the Balmer lines disappear, and now the narrow H lines seem to sit on a broader base, with vFWHM ∼ 7000 − 8000 km s−1. Unfortunately, the low signal-to-noise ratio (S/N) of some spectra and their modest resolution keep us from securely characterising these line profiles, and the presence of electron-scattering wings cannot be ruled out. Some undulations appear in the bluest spectral region (below ∼4800 Å) about two weeks after maximum, becoming more prominent in later spectra. The features are likely due to the emerging contribution of broad Fe II lines.
-
Late post-maximum decline (phases from +40 to +70 d) – This temporal window corresponds to the plateau in the light curve of SN 2023ldh shown in Fig. 1. In this phase, the spectral continuum becomes much redder and the undulations at the blue wavelengths, mostly due to blends of Fe II lines, are now more evident. A good S/N spectrum was taken at +57.3 d, and it shows an evident flux deficit below ∼4600 Å, possibly due to the blanketing of metal lines. Along with the Balmer lines with a prominent emission component, broad P Cygni features of Fe II, Sc II, and Ba II are now visible. The position of the blueshifted minimum of the metal lines constrains the velocity at the photosphere in this phase. The photospheric velocity was measured for the relatively unblended Fe II λ4923.9 (triplet 42) line. It declines from 2230 ± 790 km s−1 at +40.3 d, to 2040 ± 390 km s−1 at +49.3 d, to 1870 ± 260 km s−1 at +57.3 d, and to 1680 ± 230 km s−1 at +68.3 d. A similar evolution of the line velocity is also measured for the Sc II λ6247 (multiplet 28) feature, the Ba II λ6141.7 line (multiplet 2), and O I λλ7772−7775. Noticeably, the possible detection in this phase of O I λ8446.5 along with O I λλ7772−7775 would be consistent with the expectations for H recombination. Other metal lines unequivocally detected in this spectrum are Na ID (with a velocity systematically higher by 20−25% than other metal lines) and the Ca II NIR triplet, which becomes the most prominent spectral feature after Hα. Hα has an evident asymmetric emission profile, still dominated by a narrow emission component (vFWHM ∼ 500 − 600 km s−1) centred at the rest wavelength, an intermediate-width emission component (with vFWHM ∼ 3000 km s−1), and a slightly redshifted broader component, with a FWHM velocity fading from about 7600 km s−1 at +40.3 d to vFWHM ∼ 5300 km s−1 at +68.3 d. The spectra obtained during the plateau globally resemble those of low-luminosity type IIP SNe (e.g. Spiro et al. 2014), except for the still dominant Balmer line emission components. The overall spectral evolution of SN 2023ldh during Event B also resembles those observed in some peculiar type II events such as SN 2016bkv (Nakaoka et al. 2018; Hosseinzadeh et al. 2018) and SN 2018zd (Zhang et al. 2020; Hiramatsu et al. 2021; Callis et al. 2021), although their plateaus were longer-lasting.
-
Nebular phase (phase > +80 d) – Two spectra of SN 2023ldh were obtained during the steep post-plateau luminosity decline (at +80.3 d and +81.2 d). They still show some P Cygni features as in the previous phase, but now [Ca II] λλ7291−7323, a classical nebular feature observed in core-collapse SN spectra, starts to appear. The following spectra, obtained during the late-time photometric flattening, become fully nebular, with P Cygni features progressively vanishing, and both [Ca II] (with a total FWHM velocity of 3500−3800 km s−1) and the Ca II NIR triplet becoming more prominent. We also note that O I λ8446.5 now contributes to the broad blend with the Ca II NIR triplet. Hα remains the most prominent spectral feature, but now the narrow line component is weaker and heavily contaminated by unresolved lines of the nearby H II region (Hα, [N II] and, more marginally, [S II]). The profile of Hα in the spectra obtained from 100 to 200 d after the maximum is dominated by the intermediate-width component, which now shows a boxy profile with a FWHM velocity of about 2500 km s−1, and whose edges extend up to ∼1400 km s−1 from the rest wavelength. Hβ shows a similar profile as Hα, while the Na ID feature (perhaps blended with He I λ5875.6) is still visible. We also note in the best-resolution nebular spectra that weak narrow features are visible on top of the dominating broad Ca II lines. Similarly, weak and marginally resolved features are also visible at the position of the [O I] λλ6300−6364 doublet, and are likely produced in the unshocked CSM. A persistent blue pseudo-continuum (below ∼5600 Å) remains visible also in the latest spectra of SN 2023ldh and, as for other ejecta-CSM interacting SNe, it is usually interpreted as due to blends of Fe lines (e.g. Smith et al. 2009; Salmaso et al. 2025).
The evolution of the profiles of individual spectral lines is reported in Fig. 3, which shows the strengthening of permitted and forbidden Ca II features in our latest spectra, along with the emergence of the strongly asymmetric Hα profile. We note that weak and narrow P Cygni lines of the Ca II NIR triplet were visible only during Event A, with a velocity of 400 km s−1. At the onset of Event B, the Ca II NIR triplet is not identified, which is consistent with the rapid rise of the continuum temperature; a narrow, marginally resolved O I λ8446.5 line is instead seen in pure emission. This line becomes much weaker in the post-maximum spectra, to re-emerge again in those at phases ≳ + 100 d.
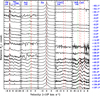 |
Fig. 3. Evolution of the profiles of individual spectral lines. From left to right: Hβ, Na ID (the dotted green line marks the position of He I λ5876), Hα, [Ca II] λλ7291,7323, and the Ca II NIR triplet (with the dotted green line marking O I λ8446.5). |
Finally, a broad Na I feature with a P Cygni profile is detected only from about 40 to 70 days past maximum. Its minimum is blueshifted by 2600 km s−1 from the rest wavelength, a velocity consistent with that inferred for the broader component of Hα.
4.3. Metallicity of the SN environment
Using the good resolution MMT spectrum obtained on 2024 March 3, we estimated the metallicity at the SN location. SN 2023ldh is, in fact, in close proximity to a luminous H II region. We measured the flux of the H II emission lines, in particular Hα, Hβ, as well as the [O III] and [N II] doublets. According to Marino et al. (2013), the above lines are good indicators of the local abundance of oxygen.
Following Marino et al. (2013), we first determined the O3N2 parameter from the flux ratios of four strong spectral lines:
![Mathematical equation: $$ \begin{aligned} \mathrm{O3N2} = \log \left(\frac{\mathrm{[O\,III]}_{\lambda 5007}}{\mathrm{H}\beta } \times \frac{\mathrm{H}\alpha }{\mathrm{[N\,II]}_{\lambda 6583}}\right)\cdot \end{aligned} $$](/articles/aa/full_html/2025/09/aa54858-25/aa54858-25-eq9.gif) (1)
(1)
The O3N2 parameter is a good proxy for the oxygen abundance when −1.1 < O3N2 < 1.7, which is the case of the H II region in the proximity of the SN (O3N2 ≈ 0.26). The oxygen abundance near the SN location was obtained through Eq. (2) of Marino et al. (2013):
 (2)
(2)
An oxygen abundance of 8.48 dex implies a slightly sub-solar metallicity for the H II region closest to the location of SN 2023ldh, which is consistent with the one inferred from the statistical approach of Pilyugin et al. (2004) based on the macroscopic properties of the host galaxy (morphological type, absolute magnitude, inclination), and computed at the SN location (12 + log (O/H) ≈ 8.47 dex). However, we note that other calibrations of the O3N2 diagnostic (e.g. Curti et al. 2017) would point towards higher values for the oxygen abundance.
5. Bolometric light curve, and time evolution of temperature and radius
Although our photometric monitoring of SN 2023ldh is limited to the optical domain, we can provide a guess of the evolution of the bolometric luminosity by performing a black-body fit to the SED. The fluxes at individual epochs are inferred from the available u to z magnitudes after correction for interstellar extinction. When observations are not available in individual filters, the fluxes are obtained through an interpolation from the available photometry at adjacent epochs, or by extrapolating the fluxes assuming a constant colour evolution. The integration of the best-fit black body at a certain epoch over the entire wavelength range allows us to estimate the bolometric luminosity. We also obtain a pseudo-bolometric light curve that includes only the contribution of the observed optical bands. For each epoch, we measured the flux contributions of the different filters using the trapezoidal rule and assuming a negligible flux contribution at the integration extremes.
The resulting ‘optical’ quasi-bolometric and bolometric light curves are shown in Fig. 4 (top panel). The evolution of the black-body temperature (Tbb), as inferred from the SED fits, is shown in the middle panel. Finally, given the luminosity and temperature information, we can estimate the evolution of the radius at the photosphere (Rph; Fig. 4, bottom panel).
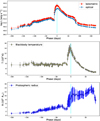 |
Fig. 4. Bolometric and quasi-bolometric (optical domain only) light curves of SN 2023ldh (top panel), black-body temperature evolution (middle panel), and evolution of the photospheric radius (bottom panel). The phases are from the bolometric light-curve maximum (MJD = 60234.8 ± 1.0), which is marked with a vertical line. |
The bolometric light curve shows a global but non-monotonic rise lasting about six months before reaching a local maximum at −30 d, which can be considered the peak of Event A, at a bolometric luminosity of  erg s−1. However, some luminosity fluctuations are clearly visible in this phase, with the strongest being at phase −100 d. The maximum of Event A is followed by a significant luminosity decline lasting about 2 weeks. At this minimum, the bolometric luminosity is a factor of 2 lower than at the time of the Event A maximum. The subsequent evolution shows a rapid luminosity rise during Event B, with a bolometric maximum reached on MJD = 60234.8 ± 1.0 (with
  erg s−1). In this phase, likely dominated by the ultraviolet emission (as indicated by the hot spectral continuum; see Sect. 4), the optical domain contributes less than 40% of the total luminosity. After maximum, the bolometric light curve monotonically declines until day +50. From about +50 to +75 d, the light curve shows a sort of plateau, at the end of which it fades very rapidly for about two weeks, to then flatten again from phase +90 d onwards. However, bolometric luminosity estimates at phases later than ∼+90 d should be taken with caution as the SED largely deviates from a black body.
As mentioned in Sect. 3, the luminosity decline rates at phases later than about three months past maximum are consistent with the expectations for a 56Co decay-powered light curve. Assuming that the late luminosity is solely powered by radioactive decays, the amount of 56Ni synthesised can be inferred from a comparison with the bolometric luminosity of SN 1987A (Catchpole et al. 1988) at the same phase after the explosion. With this method, we obtain a 56Ni mass of about 0.015 M⊙ for SN 2023ldh. However, we caution that ejecta-CSM interaction signatures are clearly visible in the SN spectra (see Sect. 4.2); hence, we should consider this value as a conservative upper limit for the amount of 56Ni ejected by SN 2023ldh.
The black-body fit to the SED provides direct information on the evolution of the temperature. During the pre-SN phases, Tbb remains in the 7000 to 8000 K range, although some fluctuations can be noticed. Tbb reaches about 8300 K at the time of the Event A peak17, then it slightly declines to about 7500 K soon before the onset of the Event B brightening. The Tbb of SN 2023ldh reaches ∼14 000 K at the time of the Event B bolometric luminosity maximum. Later, the temperature monotonically declines to reach ∼5000 K about two months after the maximum. We remark that at phases later than ∼+80 d, the spectrum is largely dominated by emission lines, which makes Tbb measurements no longer meaningful.
The photospheric radius Rph increases very slowly during Event A from ∼1000 to 5000 R⊙ at −30 d, then it decreases slightly for about two weeks. At the onset of SN 2023ldh Event B, Rph increases very rapidly to the bolometric peak and remains nearly constant from phase ∼0 to +50 d, at about 10 500 R⊙.During the plateau in the bolometric light curve, the radius rises again until Rph ∼ 14 000 R⊙ (at about +70 d), while the photosphere rapidly recedes at later phases.
6. Comparison with other SN 2009ip-like events
In Fig. 5 we compare the observed properties of SN 2023ldh with those of photometrically similar type IIn SNe for which Event A was well sampled both in photometry and spectroscopy: SN 2009ip, SN 2015bh (Elias-Rosa et al. 2016; Goranskij et al. 2016; Ofek et al. 2016; Thöne et al. 2017), and SN 2016jbu (Brennan et al. 2022a,b). The type Ibn SN 2023fyq (Brennan et al. 2024; Dong et al. 2024) is also considered as a comparison object, although spectroscopically different and with a lower-luminosity Event A than other objects of the sample. The ‘optical’ pseudo-bolometric light curves of the five objects are shown in the top-left panel, while the other three panels show their optical spectra at three reference phases: during the rise to the Event A maximum (phase ∼ −55 d; top right), in the proximity of the Event B peak (phases ∼ −6 to −1 d; bottom-left), and at late phases (> + 100 d; bottom-right).
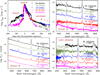 |
Fig. 5. Top-left panel: Comparison of the pseudo-bolometric light curve of SN 2023ldh, obtained by integrating the broadband fluxes in the optical domain only, with those of the type IIn SNe 2009ip, 2015bh, and 2016jbu and the type Ibn SN 2023fyq (Brennan et al. 2024; Dong et al. 2024). Other panels: Comparison of the optical spectra of SNe 2023ldh, 2009ip, 2015bh, 2016jbu, and 2023fyq at similar phases: from about −60 to −30 d (during Event A; top-right panel), a few days before the maximum of Event B (bottom-left panel), and at late phases (100−130 d after the bolometric peak; bottom-right panel). The SN 2009ip data are from Pastorello et al. (2013), Fraser et al. (2013, 2015), Margutti et al. (2014), Prieto et al. (2013), and Graham et al. (2014); those of SN 2015bh are from Elias-Rosa et al. (2016), Goranskij et al. (2016), Ofek et al. (2016), and Thöne et al. (2017); and those of SN 2016jbu are from Brennan et al. (2022a). The spectra of SN 2023fyq shown here are those of Brennan et al. (2024) and Dong et al. (2024) after a careful subtraction of nearby contaminating sources performed using a spectrum of the host environment obtained at the NOT telescope on 2023 December 25, when the SN was no longer visible. |
SN 2023ldh is marginally brighter than other SN 2009ip-like events at all phases, with a slightly longer duration of both Events A and B (Fig. 5, top-left panel). The late-time luminosity is virtually identical for all objects at the same epochs, with the exception of SN 2023fyq that is significantly fainter. All SNe are characterised by a similar decline rate after the Event B maximum, consistent with that expected for light curves powered by the radioactive decay of 56Co into 56Fe. If these bolometric light curves are powered by radioactive decays, the amount of 56Ni synthesised in these explosions should necessarily be similar for all SN 2009ip-like objects of our sample (see, however, discussion in Sect. 5). The observational analogies for the objects of our sample after years-long phases of erratic variability (Fig. 5) are somewhat surprising and may imply similarity in the progenitor systems, the CSM geometry, and the explosion mechanisms.
The spectra of the objects shown in Fig. 5 display some differences in the continuum and the line profiles during Event A. In contrast, they appear to be quite similar during Event B, although with some subtle differences, in particular in the strengths and widths of the He I lines. The He I features are quite prominent in SN 2009ip, relatively weak in SN 2015bh, and almost negligible in SN 2023ldh. This suggests either a difference in the ionisation state of the line-forming regions of the three objects or some intrinsic differences in the abundance of He-rich material. Recently, Brennan et al. (2024) and Dong et al. (2024) reported observations of the type Ibn SN 2023fyq. Despite the different spectroscopic classification, this type Ibn SN shows remarkable similarity in the photometric properties with our SN 2009ip-like sample. In particular, its light curve has a long-lasting pre-SN eruptive phase reminiscent of an Event A, followed by a more luminous Event B.
Other ejecta-CSM interacting SNe share similarities with the above objects, including several type IIn SNe18 and two transitional type IIn/Ibn events, SN 2021foa (Reguitti et al. 2022; Farias et al. 2024; Gangopadhyay et al. 2025) and SN 2022pda (Cai et al., in prep.). However, in all these cases, the available spectroscopic and photometric data do not completely cover the crucial phases of the SN evolution illustrated in Fig. 5.
7. Eruption or supernova explosion?
Long-lasting eruptive phases accompanied by a global trend of a slow luminosity rise are typical of the so-called luminous red novae (e.g. Pastorello et al. 2023, and references therein), which are thought to result from merging events of non-degenerate stars. For example, SN 2009ip-like events show rapid photometric variability followed by a slow brightening, somewhat reminiscent of the pre-outburst phase of luminous red novae (e.g. V1309 Sco; Tylenda et al. 2011; Soker & Kashi 2013).
Schrøder et al. (2020) suggest that some type IIn SNe are the outcome of the coalescence of a compact object, a black hole or a neutron star (NS), with the core of a massive companion when the system is embedded in a H-rich common envelope. Brennan et al. (2025) present a study on SN 2022mop, a transient source characterised by two spatially coincident outbursts, both with a duration and luminosity consistent with a SN explosion. Brennan et al. (2025) propose that the first event in 2022 was a genuine stripped-envelope SN in a binary system, whose remnant – likely a NS in an unstable eccentric orbit – started to interact with the outer layers of the H-rich secondary, producing the photometric fluctuations observed in 2023. The interaction within a common envelope led the orbital period to gradually decrease and the NS to merge with the secondary, producing a SN 2009ip-like event in 2024.
A somewhat similar scenario is proposed by Tsuna et al. (2024) for the type Ibn SN 2023fyq, whose properties favour a binary system with a He donor star transferring mass to a NS (or black hole) companion. The super-Eddington mass transfer triggers a circum-binary outflow from the Lagrangian point L2 and a fast wind from the accretion disk of the degenerate companion, which power the slow-rising light curve of SN 2023fyq in the years preceding the main event. The loss of angular momentum leads the two stars to merge, producing an outburst with the properties of a type Ibn SN, without necessarily a terminal core collapse. According to Tsuna et al. (2024), this model can only explain transients with smooth brightenings. Hence, while the scenario is applicable to the evolution of type IIn SNe such as SN 2021qqp (Hiramatsu et al. 2024) and SNhunt151 (Elias-Rosa et al. 2018), it cannot comfortably explain SN 2009ip-like events characterised by a former erratic, fast-evolving variability (but see Brennan et al. 2025).
Whether the rapid luminosity fluctuations of SN 2023ldh from ∼4.5 to ∼1 years before Event A are indicative of a binary interaction or erratic variability similar to luminous blue variables19 is unclear. Well-cadenced data with high S/Ns are required to determine any potential periodicity in the archival observations. However, we note that some periodicity in the mass-loss events suggesting a binary interaction was revealed by the bumps in the light curve of Event B in SN 2009ip (Kashi et al. 2013; Martin et al. 2015).
Eruptive wave-driven outbursts (e.g. Quataert & Shiode 2012; Moriya et al. 2014; Leung & Fuller 2020; Chugai 2022) or steady wind mass-loss resulting from a continuous energy deposition at the base of the stellar envelope in progenitors exceeding the Eddington luminosity are still plausible explanations for the pre-SN evolution of SN 2023ldh and similar events (Matsumoto & Metzger 2022). Mass-loss generates an optically thick CSM engulfing the progenitor. The subsequent stellar core-collapse triggers high-velocity ejecta that collide with the CSM, sustaining the Event B light curve. However, this scenario cannot reproduce the frequent short-duration flares at Mr ∼ −14 observed before Event A.
Another scenario was proposed for SN 2009ip-like objects, according to which the entire light curve is explained through a non-terminal eruptive phase of a very massive star. In particular, the CSM is produced after a long period (years) of erratic variability, during which the star loses a significant amount of envelope mass. Later, the star experiences a giant eruption (Event A) and the interaction between the material ejected in Event A with the previously gathered CSM powers Event B. In this case, the terminal SN explosion is not required for reproducing the SN observables. However, only very massive stars can release enough mass and radiate such high energy for a long time without a terminal explosion (e.g. in a pulsational pair-instability event; Woosley 2017).
Ultimately, we need to understand the fate of the progenitor (or the progenitor system) of SN 2023ldh. The study of putative survivors of former SN 2009ip-like transients gives somewhat contradictory results. While in most cases no residual source is visible at the SN location (or the source is orders of magnitudes fainter than the original quiescent progenitor) in deep images taken with space telescopes (Jencson et al. 2022; Brennan et al. 2022c; Smith et al. 2022), in at least one case (SN 2011fh) a residual source remains visible a long time after the putative SN explosion (Pessi et al. 2022; Reguitti et al. 2024); hence, the survival or the death of the progenitor stars of these interacting SNe remains an open issue. As for similar objects, only observations of the explosion site years after discovery and in multiple domains will clarify if its progenitor has survived the SN 2023ldh explosion. If a source is still detectable, a multi-band study would provide information on the bolometric luminosity and the spectral type of the survivor, which is key to retrospectively constraining the physical scenario that produced the observed chain of events culminating in SN 2023ldh. However, the late-time decline rates compatible with the 56Co decay and the similar synthesised 56Ni masses inferred for SN 2023ldh and the comparison objects in Sect. 6 favour similar progenitors and terminal core-collapse explosions for most SN 2009ip-like objects.
The next-generation surveys, such as the Legacy Survey of Space and Time (Hambleton et al. 2023) at the Vera Rubin Observatory, will provide a harvest of new type IIn SNe with precursors. The deep photometry released by the survey complemented with ancillary programmes at medium-size and large telescopes will provide key information on the progenitors and the nature of their variability, while the deep and spatially resolved imaging of space telescopes (Hubble Space Telescope, James Webb Space Telescope, and Euclid) will reveal the fate of the star after the main explosive event. In particular, very late-time observations from 0.2 to 15 μm will provide bolometric luminosity estimates for any accreting source or remaining star.
Data availability
Table A.1 is available at the CDS via https://cdsarc.cds.unistra.fr/viz-bin/cat/J/A+A/701/A32
Acknowledgments
AP, AR, GV, NER, PO and IS acknowledge support from the PRIN-INAF 2022 “Shedding light on the nature of gap transients: from the observations to the models”. NER acknowledges the Spanish Ministerio de Ciencia e Innovación (MCIN) and the Agencia Estatal de Investigación (AEI) 10.13039/501100011033 under the program Unidad de Excelencia María de Maeztu CEX2020-001058-M. YZC is supported by the National Natural Science Foundation of China (NSFC, Grant No. 12303054), the National Key Research and Development Program of China (Grant No. 2024YFA1611603), the Yunnan Fundamental Research Projects (Grant Nos. 202401AU070063, 202501AS070078), and the International Centre of Supernovae, Yunnan Key Laboratory (No. 202302AN360001). LG acknowledges financial support from AGAUR, CSIC, MCIN and AEI 10.13039/501100011033 under projects PID2023-151307NB-I00, PIE 20215AT016, CEX2020-001058-M, ILINK23001, COOPB2304, and 2021-SGR-01270. PC and TLK acknowledge support via the Research Council of Finland (grant 340613). TK acknowledges support from the Research Council of Finland project 360274. SS has received funding from the European Union’s Horizon 2022 research and innovation programme under the Marie Skłodowska-Curie grant agreement No 101105167 – FASTIDIoUS. MDS is funded by the Independent Research Fund Denmark (IRFD, grant number 10.46540/2032-00022B) and by an Aarhus Univesity Research Foundation Nova project (AUFF-E-2023-9-28). SV and the UC Davis time-domain research team acknowledge support by NSF grants AST-2407565CPG acknowledges financial support from the Secretary of Universities and Research (Government of Catalonia) and by the Horizon 2020 Research and Innovation Programme of the European Union under the Marie Skłodowska-Curie and the Beatriu de Pinós 2021 BP 00168 programme, from the Spanish Ministerio de Ciencia e Innovación (MCIN) and the Agencia Estatal de Investigación (AEI) 10.13039/501100011033 under the PID2023-151307NB-I00 SNNEXT project, from Centro Superior de Investigaciones Científicas (CSIC) under the PIE project 20215AT016 and the program Unidad de Excelencia María de Maeztu CEX2020-001058-M, and from the Departament de Recerca i Universitats de la Generalitat de Catalunya through the 2021-SGR-01270 grant. This work makes use of data from the Las Cumbres Observatory global telescope network. The LCO group is supported by NSF grants AST-1911151 and AST-1911225. The data presented herein were obtained in part with ALFOSC, which is provided by the Instituto de Astrofisica de Andalucia (IAA) under a joint agreement with the University of Copenhagen and NOT. This work is based on observations made with the Nordic Optical Telescope (NOT), owned in collaboration by the University of Turku and Aarhus University, and operated jointly by Aarhus University, the University of Turku and the University of Oslo, representing Denmark, Finland and Norway, the University of Iceland and Stockholm University at the Observatorio del Roque de los Muchachos, La Palma, Spain, of the Instituto de Astrofisica de Canarias; the 10.4 m Gran Telescopio Canarias (GTC), installed in the Spanish Observatorio del Roque de los Muchachos of the Instituto de Astrofísica de Canarias, in the Island of La Palma; the 2.0 m Liverpool Telescope operated on the island of La Palma by Liverpool John Moores University at the Spanish Observatorio del Roque de los Muchachos of the Instituto de Astrofísica de Canarias with financial support from the UK Science and Technology Facilities Council; the 3.58 m Italian Telescopio Nazionale Galileo (TNG) operated the island of La Palma by the Fundación Galileo Galilei of the Istituto Nazionale di Astrofisica (INAF) at the Spanish Observatorio del Roque de los Muchachos of the Instituto de Astrofísica de Canarias; the 1.82 m Copernico and the 67/92 cm Schmidt telescopes of INAF – Osservatorio Astronomico di Padova, Asiago, Italy. The observations reported here were obtained at the MMT Observatory, a joint facility of the Smithsonian Institution and the University of Arizona. The LRIS data presented herein were obtained at the W. M. Keck Observatory from telescope time allocated to NASA through the agency’s scientific partnership with the California Institute of Technology and the University of California. The Observatory was made possible by the generous financial support of the W. M. Keck Foundation. This work has made use of data from the Asteroid Terrestrial-impact Last Alert System (ATLAS) project. ATLAS is primarily funded to search for near-Earth objects through NASA grants NN12AR55G, 80NSSC18K0284, and 80NSSC18K1575; byproducts of the NEO search include images and catalogs from the survey area. The ATLAS science products have been made possible through the contributions of the University of Hawaii Institute for Astronomy, the Queen’s University Belfast, STScI, and the South African Astronomical Observatory, and The Millennium Institute of Astrophysics (MAS), Chile. The Pan-STARRS1 Surveys (PS1) and the PS1 public science archive have been made possible through contributions by the Institute for Astronomy, the University of Hawaii, the Pan-STARRS Project Office, the Max-Planck Society and its participating institutes, the Max Planck Institute for Astronomy, Heidelberg and the Max Planck Institute for Extraterrestrial Physics, Garching, The Johns Hopkins University, Durham University, the University of Edinburgh, the Queen’s University Belfast, the Harvard-Smithsonian Center for Astrophysics, the Las Cumbres Observatory Global Telescope Network Incorporated, the National Central University of Taiwan, STScI, NASA under grant NNX08AR22G issued through the Planetary Science Division of the NASA Science Mission Directorate, NSF grant AST-1238877, the University of Maryland, Eotvos Lorand University (ELTE), the Los Alamos National Laboratory, and the Gordon and Betty Moore Foundation. This publication is partially based on observations obtained with the Samuel Oschin 48-inch Telescope at the Palomar Observatory as part of the Zwicky Transient Facility (ZTF) project. ZTF is supported by the National Science Foundation under Grants No. AST-1440341 and AST-2034437 and a collaboration including current partners Caltech, IPAC, the Oskar Klein Center at Stockholm University, the University of Maryland, University of California, Berkeley , the University of Wisconsin at Milwaukee, University of Warwick, Ruhr University, Cornell University, Northwestern University and Drexel University. Operations are conducted by COO, IPAC, and UW. This research has made use of the NASA/IPAC Extragalactic Database (NED) which is operated by the Jet Propulsion Laboratory, California Institute of Technology, under contract with NASA. This publication used data products from the Two Micron All-Sky Survey, which is a joint project of the University of Massachusetts and the Infrared Processing and Analysis Center/California Institute of Technology, funded by NASA and the NSF. The authors wish to recognise and acknowledge the very significant cultural role and reverence that the summit of Maunakea has always had within the indigenous Hawaiian community. We are most fortunate to have the opportunity to conduct observations from this mountain.
References
- Aghakhanloo, M., Smith, N., Milne, P., et al. 2023a, MNRAS, 521, A1941 [Google Scholar]
- Aghakhanloo, M., Smith, N., Milne, P., et al. 2023b, MNRAS, 526, A456 [Google Scholar]
- Almeida, A., Anderson, S. F., Årgudo-Fernández, M., et al. 2023, ApJS, 267, 44 [NASA ADS] [CrossRef] [Google Scholar]
- Bellm, E. C., Kulkarni, S. R., Graham, M. J., et al. 2019, PASP, 121, 018002 [NASA ADS] [CrossRef] [Google Scholar]
- Brennan, S. J., Fraser, M., Johansson, J., et al. 2022a, MNRAS, 513, 5642 [NASA ADS] [Google Scholar]
- Brennan, S. J., Fraser, M., Johansson, J., et al. 2022b, MNRAS, 513, 5666 [NASA ADS] [Google Scholar]
- Brennan, S. J., Elias-Rosa, N., Fraser, M., Van Dyk, S. D., & Lyman, J. D. 2022c, A&A, 664, L18 [NASA ADS] [CrossRef] [EDP Sciences] [Google Scholar]
- Brennan, S. J., Sollerman, J., Irani, I., et al. 2024, A&A, 684, L18 [NASA ADS] [CrossRef] [EDP Sciences] [Google Scholar]
- Brennan, S. J., Bartmentloo, S., Schulze, S., et al. 2025, A&A, submitted [arXiv:2503.08768] [Google Scholar]
- Byrne, R. A., Fraser, M., Cai, Y.-Z., Reguitti, A., & Valerin, G. 2023, MNRAS, 524, 2978 [NASA ADS] [CrossRef] [Google Scholar]
- Cai, Y.-Z., Reguitti, A., Valerin, G., & Wang, X.-F. 2022, Universe, 8, 493 [NASA ADS] [CrossRef] [Google Scholar]
- Callis, E., Fraser, M., Pastorello, A., et al. 2021, ArXiv e-prints [arXiv:2109.12943] [Google Scholar]
- Catchpole, R. M., Whitelock, P. A., Feast, M. W., et al. 1988, MNRAS, 231, P75 [Google Scholar]
- Chambers, K. C., Magnier, E. A., Metcalfe, N., et al. 2016, ArXiv e-prints [arXiv:1612.05560] [Google Scholar]
- Chonis, T. S., & Gaskell, C. M. 2008, AJ, 135, 264 [NASA ADS] [CrossRef] [Google Scholar]
- Chugai, N. N. 2022, Astron. Lett., 48, 442 [Google Scholar]
- Curti, M., Cresci, G., Mannucci, F., et al. 2017, MNRAS, 465, 1384 [Google Scholar]
- Dastidar, R., Misra, K., Valenti, S., et al. 2025, A&A, 694, A260 [NASA ADS] [CrossRef] [EDP Sciences] [Google Scholar]
- De, K. 2023, TNSTR, 1431, 1 [Google Scholar]
- Dong, Y., Tsuna, D., Valenti, S., et al. 2024, ApJ, 977, 254 [Google Scholar]
- Elias-Rosa, N., Pastorello, A., Benetti, S., et al. 2016, MNRAS, 463, 3894 [NASA ADS] [CrossRef] [Google Scholar]
- Elias-Rosa, N., Benetti, S., Cappellaro, E., et al. 2018, MNRAS, 475, 2614 [NASA ADS] [CrossRef] [Google Scholar]
- Farias, D., Gall, C., Narayan, G., et al. 2024, ApJ, 977, 152 [Google Scholar]
- Flewelling, H. A., Magnier, E. A., Chambers, K. C., et al. 2020, ApJS, 251, 7 [NASA ADS] [CrossRef] [Google Scholar]
- Foley, R. J., Berger, E., Fox, O., et al. 2011, ApJ, 732, 32 [NASA ADS] [CrossRef] [Google Scholar]
- Fransson, C., Ergon, M., Challis, P. J., et al. 2014, ApJ, 797, 118 [Google Scholar]
- Fransson, C., Sollerman, J., Strotjohann, N. L., et al. 2022, A&A, 666, A79 [NASA ADS] [CrossRef] [EDP Sciences] [Google Scholar]
- Fraser, M., Inserra, C., Jerkstrand, A., et al. 2013, MNRAS, 433, 1312 [NASA ADS] [CrossRef] [Google Scholar]
- Fraser, M., Kotak, R., Pastorello, A., et al. 2015, MNRAS, 453, 3886 [Google Scholar]
- Fulton, M., Huber, M. E., Tucker, M. A., et al. 2022, TNSAN, 150, 1 [Google Scholar]
- Gangopadhyay, A., Dukiya, N., Moriya, T. J., et al. 2025, MNRAS, 537, 2898 [Google Scholar]
- Goranskij, V. P., Barsukova, E. A., Valeev, A. F., et al. 2016, Astrophys. Bull., 71, 422 [Google Scholar]
- Graham, M. L., Sand, D. J., Valenti, S., et al. 2014, ApJ, 787, 163 [NASA ADS] [CrossRef] [Google Scholar]
- Graham, M. J., Kulkarni, S. R., Bellm, E. C., et al. 2019, PASP, 131, 8001 [Google Scholar]
- Hambleton, K. M., Bianco, F. B., Street, R., et al. 2023, PASP, 135, 5002 [Google Scholar]
- Hiramatsu, D., Howell, D. A., Van Dyk, S. D., et al. 2021, Nat. Astron., 5, 903 [NASA ADS] [CrossRef] [Google Scholar]
- Hiramatsu, D., Matsumoto, T., Berger, E., et al. 2024, ApJ, 964, 181 [Google Scholar]
- Hosseinzadeh, G., Valenti, S., McCully, C., et al. 2018, ApJ, 861, 63 [NASA ADS] [CrossRef] [Google Scholar]
- Humphreys, R. M., Davidson, K., Van Dyk, S. D., & Gordon, M. S. 2017, ApJ, 848, 86 [Google Scholar]
- Irani, I., Chen, P., Morag, J., et al. 2024, ApJ, 962, 109 [Google Scholar]
- Jencson, J. E., Sand, D. J., Andrews, J. E., et al. 2022, ApJ, 935, L33 [CrossRef] [Google Scholar]
- Kashi, A., Soker, N., & Moskovitz, N. 2013, MNRAS, 436, 2484 [NASA ADS] [CrossRef] [Google Scholar]
- Kasliwal, M. M. 2012, PASA, 29, 482 [NASA ADS] [CrossRef] [Google Scholar]
- Kilpatrick, C. D., Foley, R. J., Drout, M. R., et al. 2017, MNRAS, 473, 4805 [Google Scholar]
- Leung, S.-C., & Fuller, J. 2020, ApJ, 900, L99 [Google Scholar]
- Magnier, E. A., Schlafly, E. F., Finkbeiner, D. P., et al. 2020, ApJS, 251, 6 [NASA ADS] [CrossRef] [Google Scholar]
- Margutti, R., Milisavljevic, D., & Soderberg, A. M. 2014, ApJ, 780, 21 [Google Scholar]
- Marino, R. A., Rosales-Ortega, F. F., Sánchez, S. F., et al. 2013, A&A, 559, A114 [NASA ADS] [CrossRef] [EDP Sciences] [Google Scholar]
- Martin, J. C., Hambsch, F.-J., Margutti, R., et al. 2015, AJ, 149, 9 [NASA ADS] [CrossRef] [Google Scholar]
- Matilainen, K. K., Kankare, E., Mattila, S., et al. 2025, A&A, submitted [Google Scholar]
- Matsumoto, T., & Metzger, B. D. 2022, ApJ, 936, 114 [CrossRef] [Google Scholar]
- Mauerhan, J. C., Smith, N., Filippenko, A. V., et al. 2013, MNRAS, 430, 1801 [NASA ADS] [CrossRef] [Google Scholar]
- Maund, J. R., Smartt, S. J., Kudritzki, R.-P., et al. 2006, MNRAS, 369, 390 [NASA ADS] [CrossRef] [Google Scholar]
- Moriya, T. J., Maeda, K., Taddia, F., et al. 2013, MNRAS, 435, 1520 [CrossRef] [Google Scholar]
- Moriya, T. J., Maeda, K., Taddia, F., et al. 2014, MNRAS, 439, 2917 [NASA ADS] [CrossRef] [Google Scholar]
- Mould, J. R., Huchra, J. P., Freedman, W. L., et al. 2000, ApJ, 529, 786 [Google Scholar]
- Müller, A., Frohn, V., Dirks, L., et al. 2023, A&A, 670, A130 [NASA ADS] [CrossRef] [EDP Sciences] [Google Scholar]
- Nakaoka, T., Kawabata, K. S., Maeda, K., et al. 2018, ApJ, 859, 78 [NASA ADS] [CrossRef] [Google Scholar]
- Nyholm, A., Sollerman, J., Taddia, F., et al. 2017, A&A, 605, A6 [NASA ADS] [CrossRef] [EDP Sciences] [Google Scholar]
- Ofek, E. O., Sullivan, M., Cenko, S. B., et al. 2013, Nature, 494, 65 [CrossRef] [Google Scholar]
- Ofek, E. O., Sullivan, M., Shaviv, N. J., et al. 2014, ApJ, 789, 104 [NASA ADS] [CrossRef] [Google Scholar]
- Ofek, E. O., Cenko, S. B., Shaviv, N. J., et al. 2016, ApJ, 824, 6 [CrossRef] [Google Scholar]
- Pastorello, A., & Fraser, M. 2019, Nat. Astron., 3, 676 [Google Scholar]
- Pastorello, A., Turatto, M., Benetti, S., et al. 2002, MNRAS, 333, 27 [Google Scholar]
- Pastorello, A., Smartt, S. J., Mattila, S., et al. 2007, Nature, 447, 829 [NASA ADS] [CrossRef] [Google Scholar]
- Pastorello, A., Botticella, M.-T., Trundle, C., et al. 2010, MNRAS, 408, 181 [NASA ADS] [CrossRef] [Google Scholar]
- Pastorello, A., Cappellaro, E., Inserra, C., et al. 2013, ApJ, 767, 1 [NASA ADS] [CrossRef] [Google Scholar]
- Pastorello, A., Kochanek, C. S., Fraser, M., et al. 2018, MNRAS, 474, 197 [NASA ADS] [CrossRef] [Google Scholar]
- Pastorello, A., Reguitti, A., Morales-Garoffolo, A., et al. 2019, A&A, 628, A93 [NASA ADS] [CrossRef] [EDP Sciences] [Google Scholar]
- Pastorello, A., Reguitti, A., Fiscale, S., et al. 2023, TNSCR, 2582, 1 [Google Scholar]
- Perley, D. A. 2019, PASP, 131, 084503 [Google Scholar]
- Pessi, T., Prieto, J. L., & Monard, B. 2022, A&A, 662, L10 [NASA ADS] [CrossRef] [EDP Sciences] [Google Scholar]
- Pilyugin, L. S., Vílchez, J. M., & Contini, T. 2004, A&A, 425, 849 [NASA ADS] [CrossRef] [EDP Sciences] [Google Scholar]
- Poznanski, D., Prochaska, J. X., & Bloom, J. S. 2012, MNRAS, 426, 1465 [Google Scholar]
- Prieto, J. L., Brimacombe, J., Drake, A. J., & Howerton, S. 2013, ApJ, 763, L27 [NASA ADS] [CrossRef] [Google Scholar]
- Pustilnik, S. A., & Perepelitsyna, Y. A. 2025, A&A, 695, L7 [NASA ADS] [CrossRef] [EDP Sciences] [Google Scholar]
- Quataert, E., & Shiode, J. 2012, MNRAS, 423, L92 [NASA ADS] [CrossRef] [Google Scholar]
- Reguitti, A., Pastorello, A., Pignata, G., et al. 2019, MNRAS, 482, 2750 [NASA ADS] [Google Scholar]
- Reguitti, A., Pastorello, A., Pignata, G., et al. 2022, A&A, 662, L10 [NASA ADS] [CrossRef] [EDP Sciences] [Google Scholar]
- Reguitti, A., Pastorello, A., & Pignata, G. 2024, A&A, 686, A231 [NASA ADS] [CrossRef] [EDP Sciences] [Google Scholar]
- Salmaso, I., Cappellaro, E., Tartaglia, L., et al. 2025, A&A, 695, A29 [NASA ADS] [CrossRef] [EDP Sciences] [Google Scholar]
- Schlafly, E. F., & Finkbeiner, D. P. 2011, ApJ, 737, 103 [Google Scholar]
- Schrøder, S. L., MacLeod, M., Loeb, A., Vigna-Gómez, A., & Mandel, I. 2020, ApJ, 892, 13 [CrossRef] [Google Scholar]
- Smith, N. 2014, ARA&A, 52, 487 [NASA ADS] [CrossRef] [Google Scholar]
- Smith, N., Silverman, J. M., Chornock, R., et al. 2009, ApJ, 695, 1334 [Google Scholar]
- Smith, N., Miller, A., Li, W., et al. 2010, AJ, 139, 1451 [NASA ADS] [CrossRef] [Google Scholar]
- Smith, K. W., Smartt, S. J., Young, D. R., et al. 2020, PASP, 132, 085002 [Google Scholar]
- Smith, N., Andrews, J. E., Filippenko, A. V., et al. 2022, MNRAS, 515, 71 [NASA ADS] [CrossRef] [Google Scholar]
- Soker, N., & Kashi, A. 2013, ApJ, 764, L6 [Google Scholar]
- Sollerman, J., Zimmerman, E., Irani, I., et al. 2022, TNSTR, 1948, 1 [Google Scholar]
- Spiro, S., Pastorello, A., Pumo, M. L., et al. 2014, MNRAS, 439, 2873 [Google Scholar]
- Strotjohann, N. L., Ofek, E. O., Gal-Yam, A., et al. 2021, ApJ, 907, 99 [NASA ADS] [CrossRef] [Google Scholar]
- Svirski, G., Nakar, H., & Sari, R. 2012, ApJ, 759, 108 [NASA ADS] [CrossRef] [Google Scholar]
- Tartaglia, L., Pastorello, A., Sullivan, M., et al. 2016, MNRAS, 459, 1039 [NASA ADS] [CrossRef] [Google Scholar]
- Thöne, C., de Ugarte Portigo, A., Leloudas, G., et al. 2017, A&A, 599, A129 [NASA ADS] [CrossRef] [EDP Sciences] [Google Scholar]
- Tonry, J. L., Denneau, L., Heinze, A. N., et al. 2018, PASP, 130, 064505 [Google Scholar]
- Tsuna, D., Wu, S. C., Fuller, J., Dong, Y., & Piro, A. L. 2024, Open J. Astrophys., 7, 47 [CrossRef] [Google Scholar]
- Tully, R. B., Courtois, H. M., Dolphin, A. E., et al. 2013, AJ, 146, 86 [NASA ADS] [CrossRef] [Google Scholar]
- Tylenda, R., Hajduk, M., Kamiński, T., et al. 2011, A&A, 528, A114 [NASA ADS] [CrossRef] [EDP Sciences] [Google Scholar]
- Valerin, G., Pastorello, A., Mason, E., et al. 2025, A&A, 695, A43 [NASA ADS] [CrossRef] [EDP Sciences] [Google Scholar]
- Wagner, R. M., Vrba, F. J., Henden, A. A., et al. 2004, PASP, 116, 326 [CrossRef] [Google Scholar]
- Weis, K., & Bomans, D. J. 2005, MNRAS, 429, L13 [Google Scholar]
- Woosley, S. E. 2017, ApJ, 836, 244 [Google Scholar]
- Yadavalli, S. K., Villar, V. A., Izzo, L., et al. 2024, ApJ, 972, 194 [Google Scholar]
- Zhang, J., Wang, X.-F., Vinkó, J., et al. 2020, MNRAS, 498, 84 [NASA ADS] [CrossRef] [Google Scholar]
- Zimmerman, E., Irani, I., Cheng, O., et al. 2022, TNSAN, 142, 1 [Google Scholar]
The object is also known with the following survey designations: ZTF23aamanim, ATLAS23qiw, and PS23hmg.
This Tully-Fisher distance to NGC 5875 is consistent with the kinematic distance (after corrections for the influence of the Virgo Cluster, the Great Attractor, and the Shapley Supercluster); adopting the same cosmologic parameters as above, we obtain μ = 33.70 ± 0.15 mag (Mould et al. 2000).
Images retrieved through the NASA/IPAC Infrared Science Archive: https://irsa.ipac.caltech.edu/Missions/ztf.html
The template-subtracted forced photometry is released through the Asteroid Terrestrial-impact Last Alert System (ATLAS) data-release interface: https://fallingstar-data.com/forcedphot/queue/
SNOOPY is a package for SN photometry using point-spread function (PSF) fitting and/or template subtraction developed by E. Cappellaro. A package description can be found at the website: http://sngroup.oapd.inaf.it/ecsnoopy.html
We used stacked Pan-STARRS images obtained before 2015 as templates in the Sloan g, r, i and z bands. For Johnson-Bessell B, V and Sloan u images, we used templates collected through the LCO archive, and obtained during the observational campaign of SN 2022oqn, when the magnitude of the precursor of SN 2023ldh was g > 22 mag.
Table A.1 is available in electronic form at the CDS, and contains the following information: the epoch and the MJD of the observation (Columns 1 and 2, respectively); the filter (Column 3); the magnitude and the error (Columns 4 and 5, respectively); the instrumental configuration (Column 6), additional information (Column 7).
The error on the absolute magnitude is largely dominated by the uncertainty on the host galaxy distance.
We estimate the following decline rates in the other bands: γu = 8.4 ± 0.3 mag (100 d)−1, γg = 6.5 ± 0.1 mag (100 d)−1, γi = 4.9 ± 0.1 mag (100 d)−1, γz = 4.3 ± 0.1 mag (100 d)−1, γB = 7.3 ± 0.2 mag (100 d)−1, γV = 5.7 ± 0.1 mag (100 d)−1.
The decline rates in this phase in the other bands are γg = 1.07 ± 0.04 mag (100 d)−1γi = 0.87 ± 0.05 mag (100 d)−1, γz = 0.80 ± 0.04 mag (100 d)−1, γV = 1.02 ± 0.05 mag (100 d)−1.
FOSCGUI is a graphical user interface aimed at extracting SN spectroscopy and photometry obtained with FOSC-like instruments. It was developed by E. Cappellaro. A package description can be found at sngroup.oapd.inaf.it/foscgui.html
But see Byrne et al. (2023) for a discussion on the limits of this method, at least when applied to another class of ejecta-CSM interacting transients.
The FWHM values reported in this paper are corrected for spectral resolution broadening.
We note that this temperature is lower by almost 1000 K from that inferred by fitting the spectral continuum (see Sect. 4.2).
The group of SN 2009ip-like type IIn SNe also includes SN 2010mc (Ofek et al. 2013), iPTF13z (Nyholm et al. 2017), SN 2013gc (Reguitti et al. 2019), SNhunt151 (Elias-Rosa et al. 2018), LSQ13zm (Tartaglia et al. 2016), SN 2016cvk (Matilainen et al. 2025), SN 2016bdu (Pastorello et al. 2018), SN 2018cnf (Pastorello et al. 2019), SN 2019zrk (Fransson et al. 2022), SN 2021qqp (Hiramatsu et al. 2024), and the 2024 event following SN 2022mop (Brennan et al. 2025).
An example is V37 in NGC 2403 (Weis & Bomans 2005; Maund et al. 2006; Humphreys et al. 2017).
All Tables
Timing (MJDs) and apparent and absolute magnitudes at maximum in the different bands, as obtained from fitting the light curve with a low-order polynomial.
All Figures
|
Fig. 1. Observed multi-band light curves of SN 2023ldh. Top panel: Blown-up view of the light curve containing the two main brightening episodes: Event A and Event B. Vertical thin grey lines mark the epochs of the spectroscopic observations. Bottom panel: Light curves of SN 2023ldh in a limited number of filters, spanning a period of about nine years. Johnson-Bessell data are in Vega magnitude scale, while Sloan and ATLAS data are in AB magnitude scale. The phases are computed from the time of the r-band Event B maximum (MJD = 60237.0 ± 0.4). |
| In the text | |
|
Fig. 2. Sequence of optical spectra of SN 2023ldh obtained during Event A (top panel), around the maximum of Event B (middle panel), and at phases later than about four weeks from the Event B peak (bottom panel). The spectra are corrected for the redshift (z = 0.011321) of the nearby source known as SDSS J150912.08+523154.3. |
| In the text | |
|
Fig. 3. Evolution of the profiles of individual spectral lines. From left to right: Hβ, Na ID (the dotted green line marks the position of He I λ5876), Hα, [Ca II] λλ7291,7323, and the Ca II NIR triplet (with the dotted green line marking O I λ8446.5). |
| In the text | |
|
Fig. 4. Bolometric and quasi-bolometric (optical domain only) light curves of SN 2023ldh (top panel), black-body temperature evolution (middle panel), and evolution of the photospheric radius (bottom panel). The phases are from the bolometric light-curve maximum (MJD = 60234.8 ± 1.0), which is marked with a vertical line. |
| In the text | |
|
Fig. 5. Top-left panel: Comparison of the pseudo-bolometric light curve of SN 2023ldh, obtained by integrating the broadband fluxes in the optical domain only, with those of the type IIn SNe 2009ip, 2015bh, and 2016jbu and the type Ibn SN 2023fyq (Brennan et al. 2024; Dong et al. 2024). Other panels: Comparison of the optical spectra of SNe 2023ldh, 2009ip, 2015bh, 2016jbu, and 2023fyq at similar phases: from about −60 to −30 d (during Event A; top-right panel), a few days before the maximum of Event B (bottom-left panel), and at late phases (100−130 d after the bolometric peak; bottom-right panel). The SN 2009ip data are from Pastorello et al. (2013), Fraser et al. (2013, 2015), Margutti et al. (2014), Prieto et al. (2013), and Graham et al. (2014); those of SN 2015bh are from Elias-Rosa et al. (2016), Goranskij et al. (2016), Ofek et al. (2016), and Thöne et al. (2017); and those of SN 2016jbu are from Brennan et al. (2022a). The spectra of SN 2023fyq shown here are those of Brennan et al. (2024) and Dong et al. (2024) after a careful subtraction of nearby contaminating sources performed using a spectrum of the host environment obtained at the NOT telescope on 2023 December 25, when the SN was no longer visible. |
| In the text | |
Current usage metrics show cumulative count of Article Views (full-text article views including HTML views, PDF and ePub downloads, according to the available data) and Abstracts Views on Vision4Press platform.
Data correspond to usage on the plateform after 2015. The current usage metrics is available 48-96 hours after online publication and is updated daily on week days.
Initial download of the metrics may take a while.