Open Access
Fig. 3.
Download original image
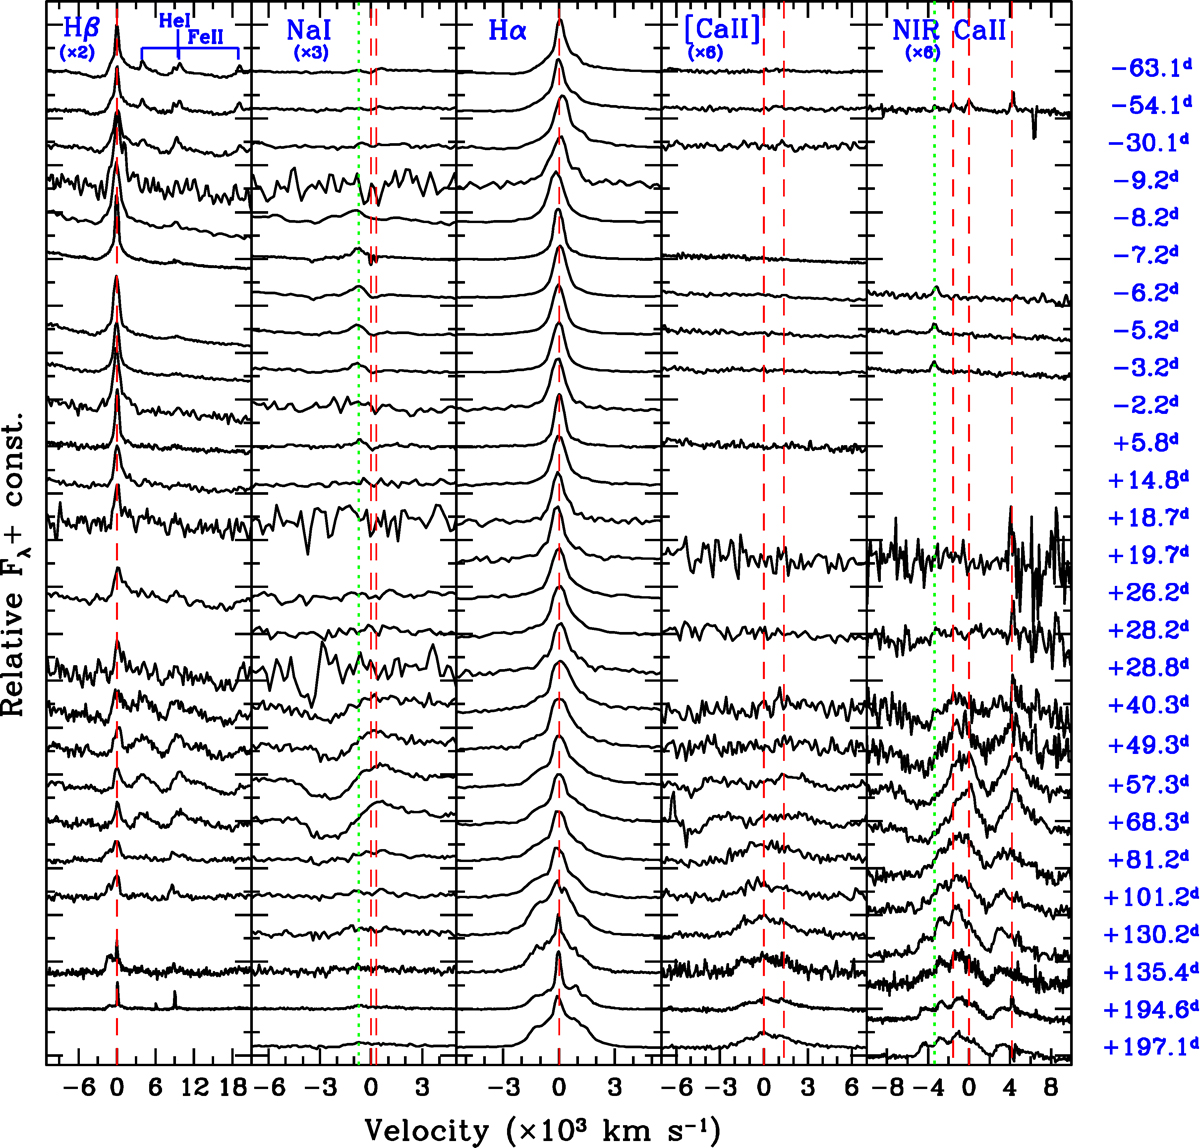
Evolution of the profiles of individual spectral lines. From left to right: Hβ, Na ID (the dotted green line marks the position of He I λ5876), Hα, [Ca II] λλ7291,7323, and the Ca II NIR triplet (with the dotted green line marking O I λ8446.5).
Current usage metrics show cumulative count of Article Views (full-text article views including HTML views, PDF and ePub downloads, according to the available data) and Abstracts Views on Vision4Press platform.
Data correspond to usage on the plateform after 2015. The current usage metrics is available 48-96 hours after online publication and is updated daily on week days.
Initial download of the metrics may take a while.