Fig. 5.
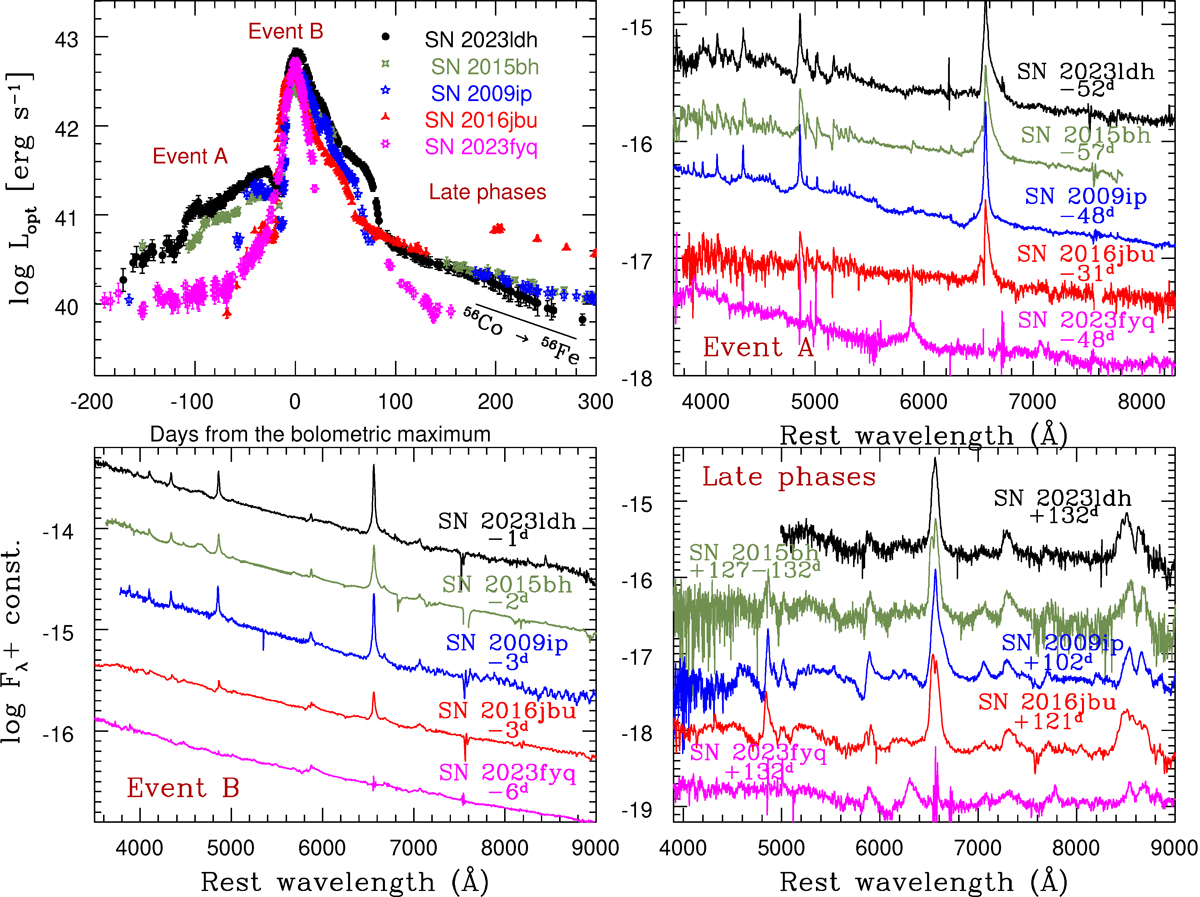
Download original image
Top-left panel: Comparison of the pseudo-bolometric light curve of SN 2023ldh, obtained by integrating the broadband fluxes in the optical domain only, with those of the type IIn SNe 2009ip, 2015bh, and 2016jbu and the type Ibn SN 2023fyq (Brennan et al. 2024; Dong et al. 2024). Other panels: Comparison of the optical spectra of SNe 2023ldh, 2009ip, 2015bh, 2016jbu, and 2023fyq at similar phases: from about −60 to −30 d (during Event A; top-right panel), a few days before the maximum of Event B (bottom-left panel), and at late phases (100−130 d after the bolometric peak; bottom-right panel). The SN 2009ip data are from Pastorello et al. (2013), Fraser et al. (2013, 2015), Margutti et al. (2014), Prieto et al. (2013), and Graham et al. (2014); those of SN 2015bh are from Elias-Rosa et al. (2016), Goranskij et al. (2016), Ofek et al. (2016), and Thöne et al. (2017); and those of SN 2016jbu are from Brennan et al. (2022a). The spectra of SN 2023fyq shown here are those of Brennan et al. (2024) and Dong et al. (2024) after a careful subtraction of nearby contaminating sources performed using a spectrum of the host environment obtained at the NOT telescope on 2023 December 25, when the SN was no longer visible.
Current usage metrics show cumulative count of Article Views (full-text article views including HTML views, PDF and ePub downloads, according to the available data) and Abstracts Views on Vision4Press platform.
Data correspond to usage on the plateform after 2015. The current usage metrics is available 48-96 hours after online publication and is updated daily on week days.
Initial download of the metrics may take a while.