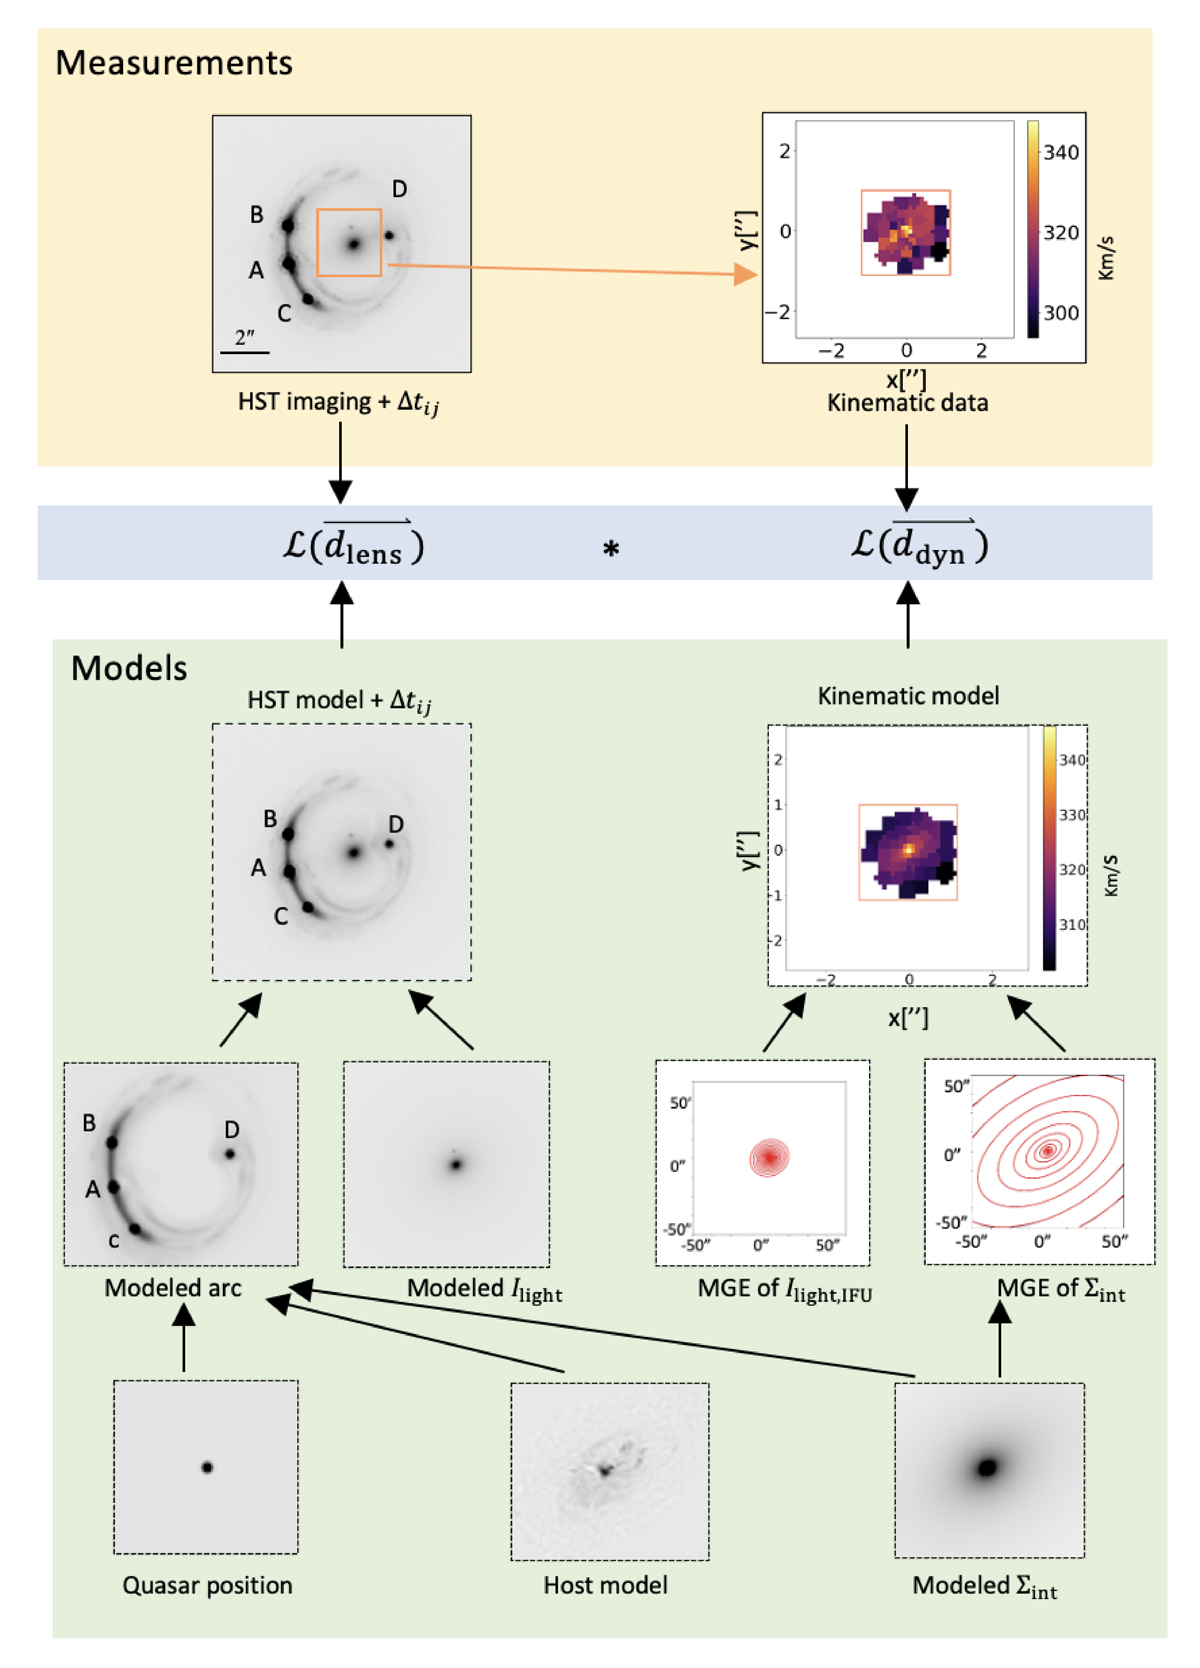
Fig. 2.
Download original image
Workflow for the joint modeling using RXJ 1131 as an example. The input datasets consisted of photometric images and the spatial kinematics of the lens galaxy. The red contours in the middle right of the green panel represent the isocontours of both the light and mass density distributions of the lens galaxy, derived from the MGE method (see Sect. 3.2). The modeled Ilight represents the light fitted from optical imaging, and Ilight, IFU corresponds to the light near the spectral absorption lines in the IFU data. In the paper, Ilight is equivalent to Ilight, IFU. We employed an MCMC sampler to simultaneously sample the parameter space ηLD for the lensing and the dynamical modeling.
Current usage metrics show cumulative count of Article Views (full-text article views including HTML views, PDF and ePub downloads, according to the available data) and Abstracts Views on Vision4Press platform.
Data correspond to usage on the plateform after 2015. The current usage metrics is available 48-96 hours after online publication and is updated daily on week days.
Initial download of the metrics may take a while.