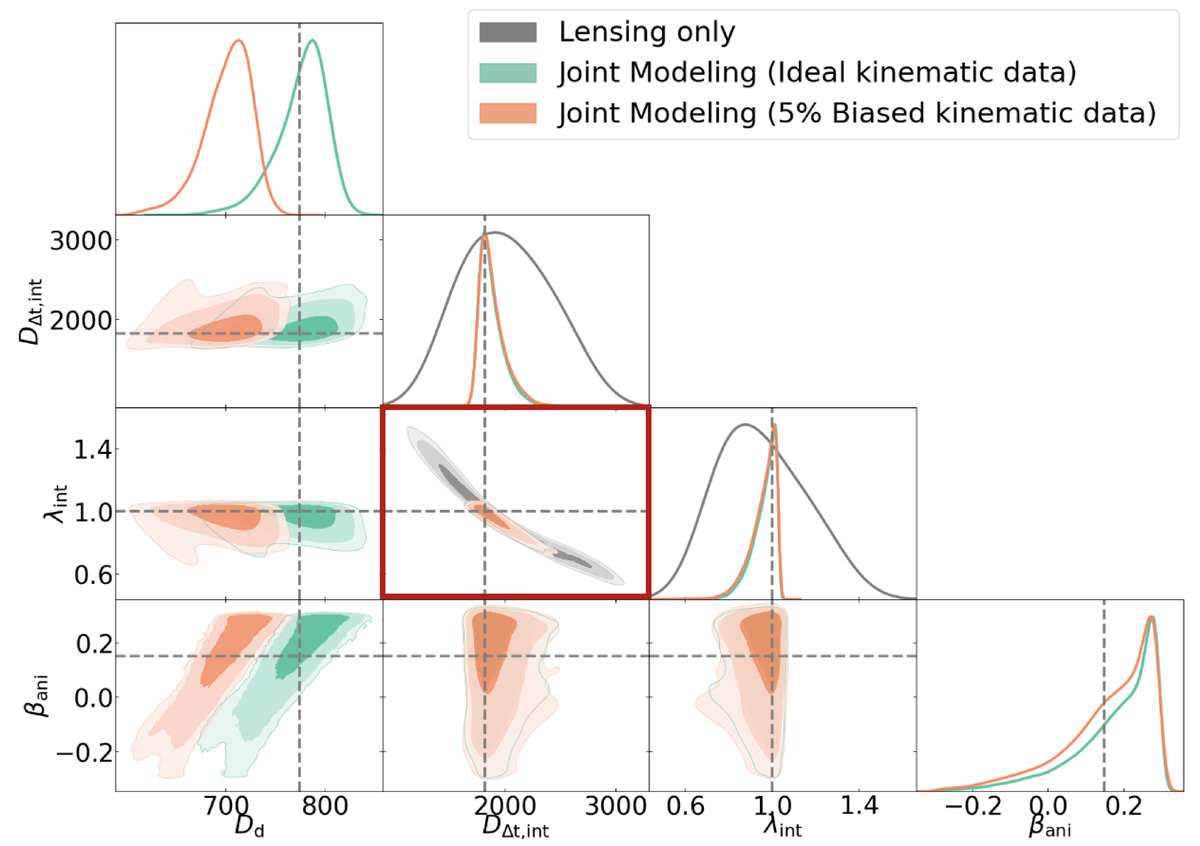
Fig. 4.
Download original image
Measurements from the joint modeling (combining all mass models) and lensing-only modeling. The shaded contours represent 1σ, 2σ, and 3σ confidence regions. The green contours correspond to the joint modeling using the ideal kinematic data, and the orange contours correspond to the joint modeling using kinematic data with a 5% systematic bias. The gray contours represent the lensing-only modeling. The red box indicates the degeneracy between DΔt, int and λint in the lensing-only modeling.
Current usage metrics show cumulative count of Article Views (full-text article views including HTML views, PDF and ePub downloads, according to the available data) and Abstracts Views on Vision4Press platform.
Data correspond to usage on the plateform after 2015. The current usage metrics is available 48-96 hours after online publication and is updated daily on week days.
Initial download of the metrics may take a while.