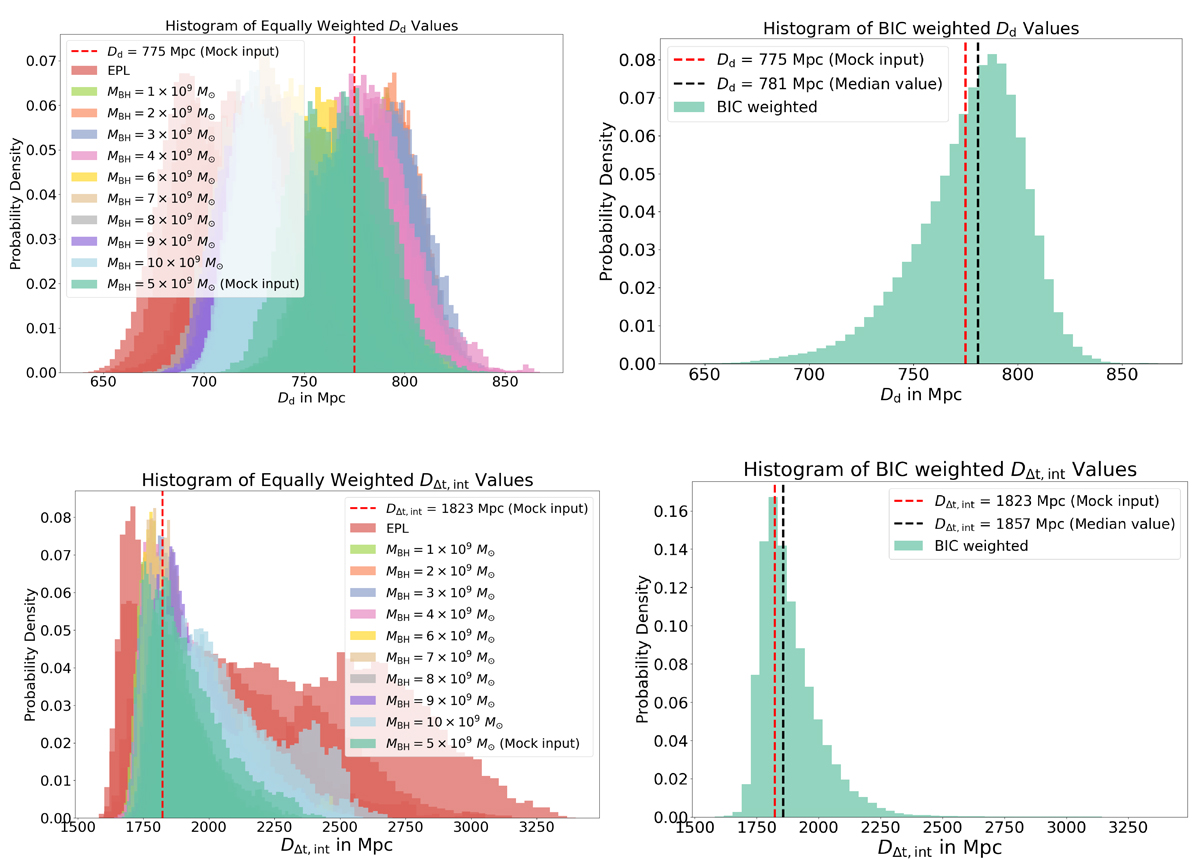
Fig. 5.
Download original image
Top panels: Marginalized posterior density distribution of Dd, based on the joint models using ideal kinematic data. The different colors represent posterior densities corresponding to different BH masses, while each color represents five separate posterior distributions that are tightly clustered together, corresponding to models with identical mass parameterizations but different source-grid resolutions. The red color represents EPL mass models, where a small softening scale of rsoft = 0.01″ mimics the presence of a massive BH, eliminating the need to explicitly include an additional MBH. The left panel shows equally weighted Dd posterior densities, whereas the right panel presents the combined Dd posterior density weighted by BIC (see Sect. 3.4). Bottom panels: Marginalized posterior density distribution of DΔt, int, based on joint models using ideal kinematic data. The red dashed lines in both panels indicate the mock input values used in the simulated data. The black dashed lines represent the median values in the BIC-weighted distribution.
Current usage metrics show cumulative count of Article Views (full-text article views including HTML views, PDF and ePub downloads, according to the available data) and Abstracts Views on Vision4Press platform.
Data correspond to usage on the plateform after 2015. The current usage metrics is available 48-96 hours after online publication and is updated daily on week days.
Initial download of the metrics may take a while.