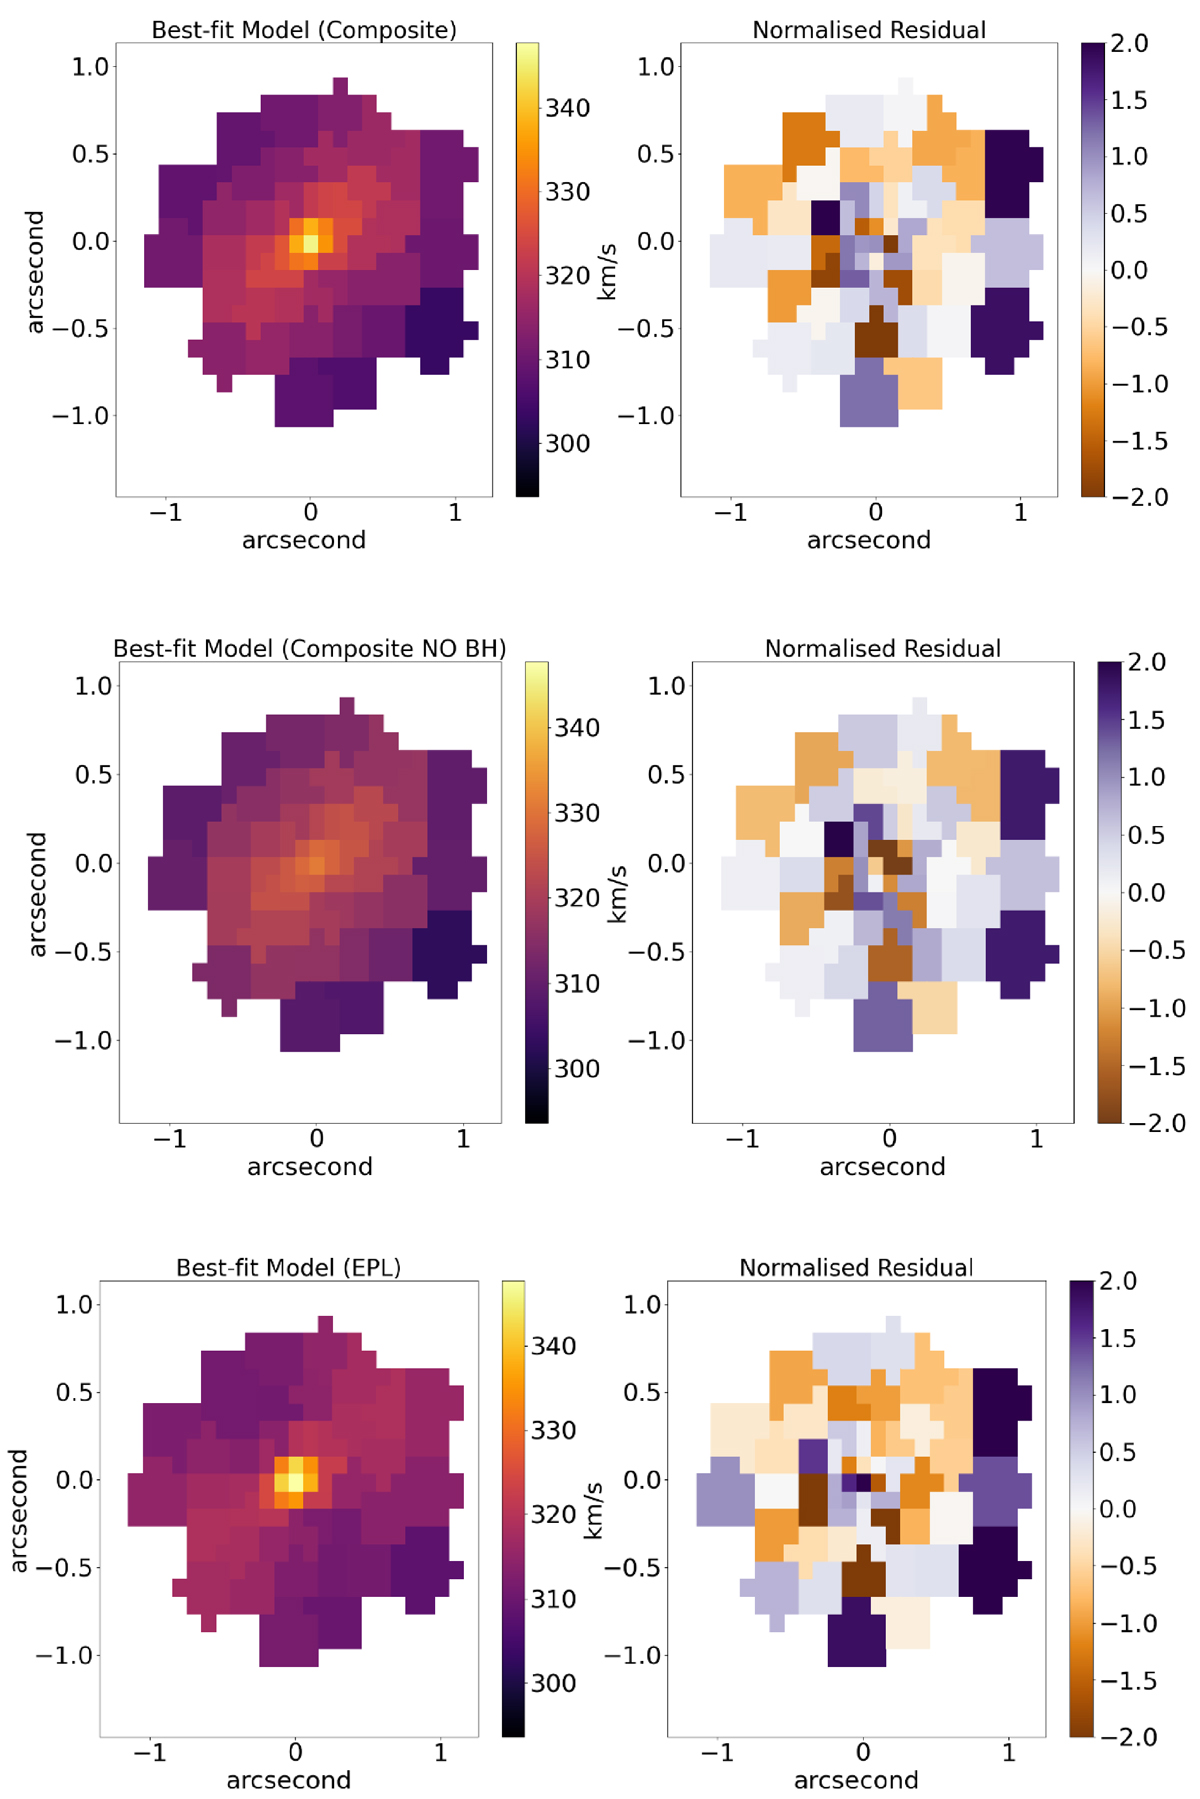
Fig. 6.
Download original image
Best-fit kinematic maps from the joint models for different BH mass assumptions. The displayed kinematic bin maps have 52 bins in total. Upper Panel: Joint modeling is performed using a grid of MBH values ranging from 109 to 1010 M⊙. In each model, the BH mass is fixed and incremented in steps of 109 M⊙ within this range. The best-fit kinematic map, corresponding to MBH = 3 × 10⁹ M⊙, achieves χdyn2 = 50. Middle Panel: The best-fit kinematic map from joint modeling that assumes no BH, yielding χdyn2 = 64. Lower Panel: The best-fit kinematic map from joint modeling using the EPL mass profile, resulting in χdyn2 = 58.
Current usage metrics show cumulative count of Article Views (full-text article views including HTML views, PDF and ePub downloads, according to the available data) and Abstracts Views on Vision4Press platform.
Data correspond to usage on the plateform after 2015. The current usage metrics is available 48-96 hours after online publication and is updated daily on week days.
Initial download of the metrics may take a while.