Fig. 7.
Download original image
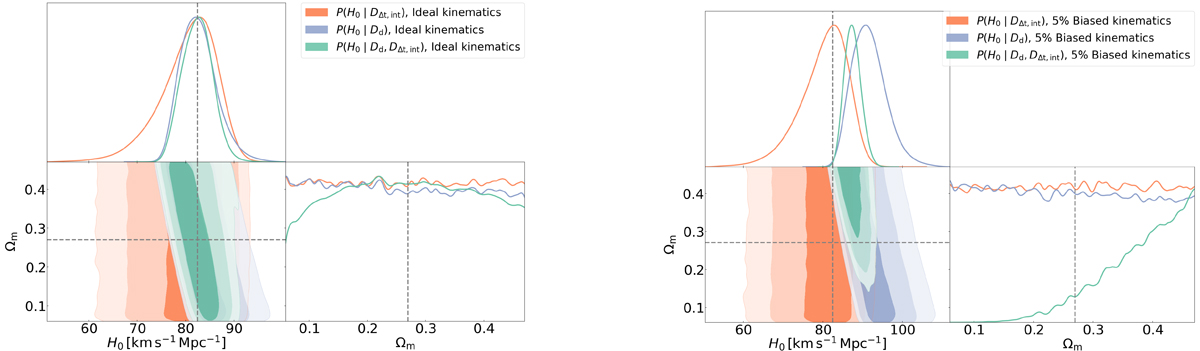
H0 and Ωm constraints from our models in a flat ![]() cosmology for the ideal (left) and kinematic data with a bias of 5% (right). The shaded contours represent 1σ, 2σ, and 3σ confidence regions. The blue (orange) contours represent the constraints based on P(Dd) (P(DΔt, int)), marginalized over all other parameters in the joint modeling. The green contours represent the constraints based on P(Dd, DΔt, int). The gray dashed lines represent the mock input values in the data sets. The kinematic data, with a 5% systematic bias, affects only Dd, such that the inferred H0 median value based on P(Dd) is biased by 13% relative to the mock input value of H0 (see right panel).
cosmology for the ideal (left) and kinematic data with a bias of 5% (right). The shaded contours represent 1σ, 2σ, and 3σ confidence regions. The blue (orange) contours represent the constraints based on P(Dd) (P(DΔt, int)), marginalized over all other parameters in the joint modeling. The green contours represent the constraints based on P(Dd, DΔt, int). The gray dashed lines represent the mock input values in the data sets. The kinematic data, with a 5% systematic bias, affects only Dd, such that the inferred H0 median value based on P(Dd) is biased by 13% relative to the mock input value of H0 (see right panel).
Current usage metrics show cumulative count of Article Views (full-text article views including HTML views, PDF and ePub downloads, according to the available data) and Abstracts Views on Vision4Press platform.
Data correspond to usage on the plateform after 2015. The current usage metrics is available 48-96 hours after online publication and is updated daily on week days.
Initial download of the metrics may take a while.