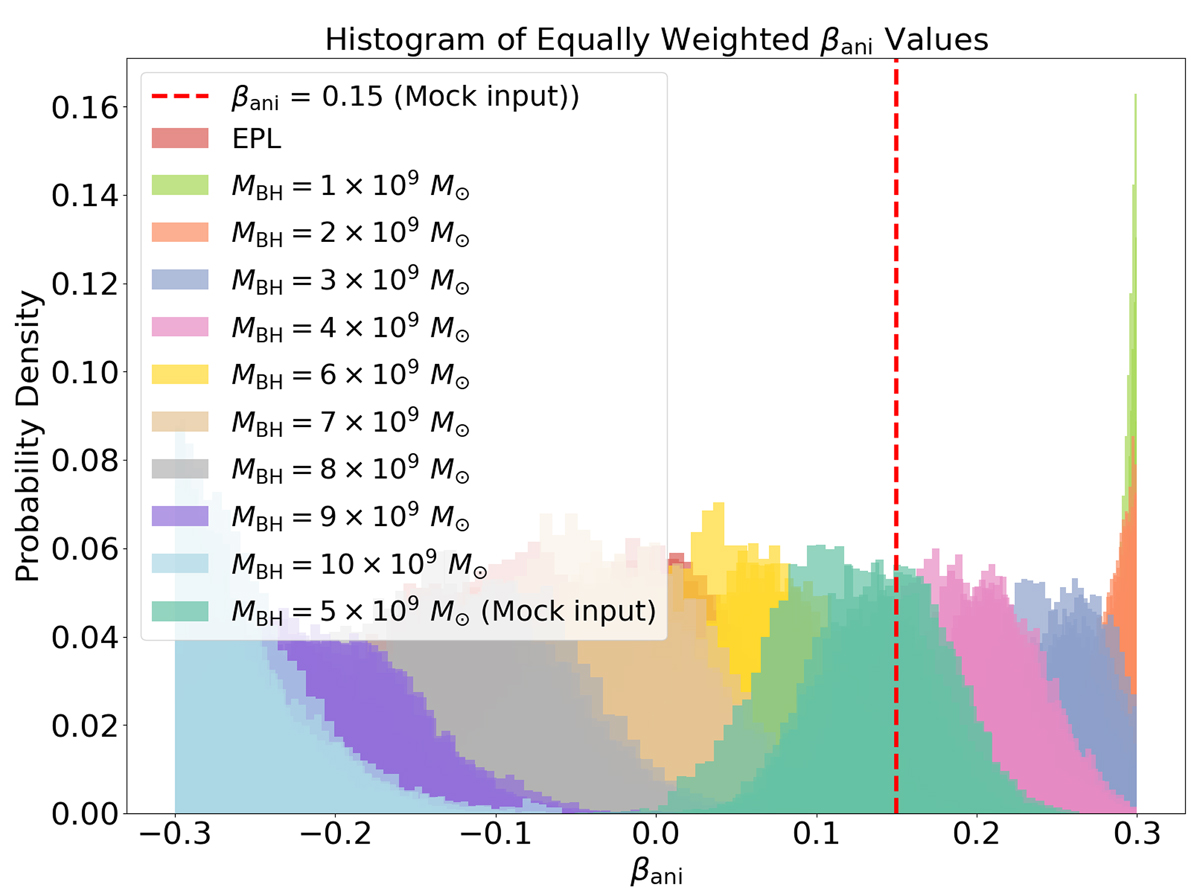
Fig. 8.
Download original image
Marginalized posterior density distribution of βani based on the joint models using ideal kinematic data. Different colors represent posterior densities corresponding to different BH masses, while the same color indicates models with identical mass parameterization but different source grid resolutions. We observe that as MBH increases, the inferred βani decreases and vice versa. The inferred βani distributions given different MBH spread over the prior range [−0.3,0.3], but different MBH yield different goodness of fit to the kinematic data (as shown in Fig. 5).
Current usage metrics show cumulative count of Article Views (full-text article views including HTML views, PDF and ePub downloads, according to the available data) and Abstracts Views on Vision4Press platform.
Data correspond to usage on the plateform after 2015. The current usage metrics is available 48-96 hours after online publication and is updated daily on week days.
Initial download of the metrics may take a while.