Fig. 9.
Download original image
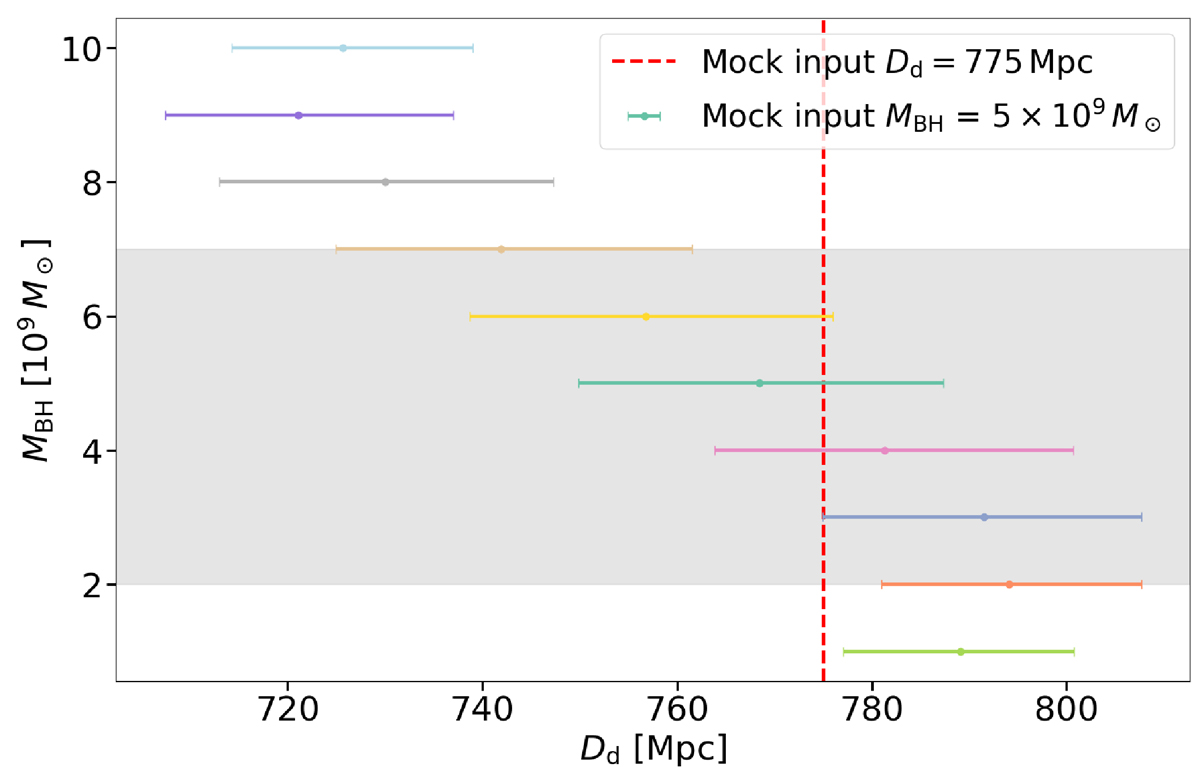
MBH vs. Dd with 1σ uncertainties based on the ideal kinematic data. This provides a clearer visualization of the upper-left panel in Fig. 5. The plot also illustrates how the BH mass affects the inference of Dd, given that βani is within the prior range of −0.3 to 0.3. The gray shaded region represents models with the BH mass satisfying ![]() , indicating a significant contribution to Dd when combining all models together.
, indicating a significant contribution to Dd when combining all models together.
Current usage metrics show cumulative count of Article Views (full-text article views including HTML views, PDF and ePub downloads, according to the available data) and Abstracts Views on Vision4Press platform.
Data correspond to usage on the plateform after 2015. The current usage metrics is available 48-96 hours after online publication and is updated daily on week days.
Initial download of the metrics may take a while.