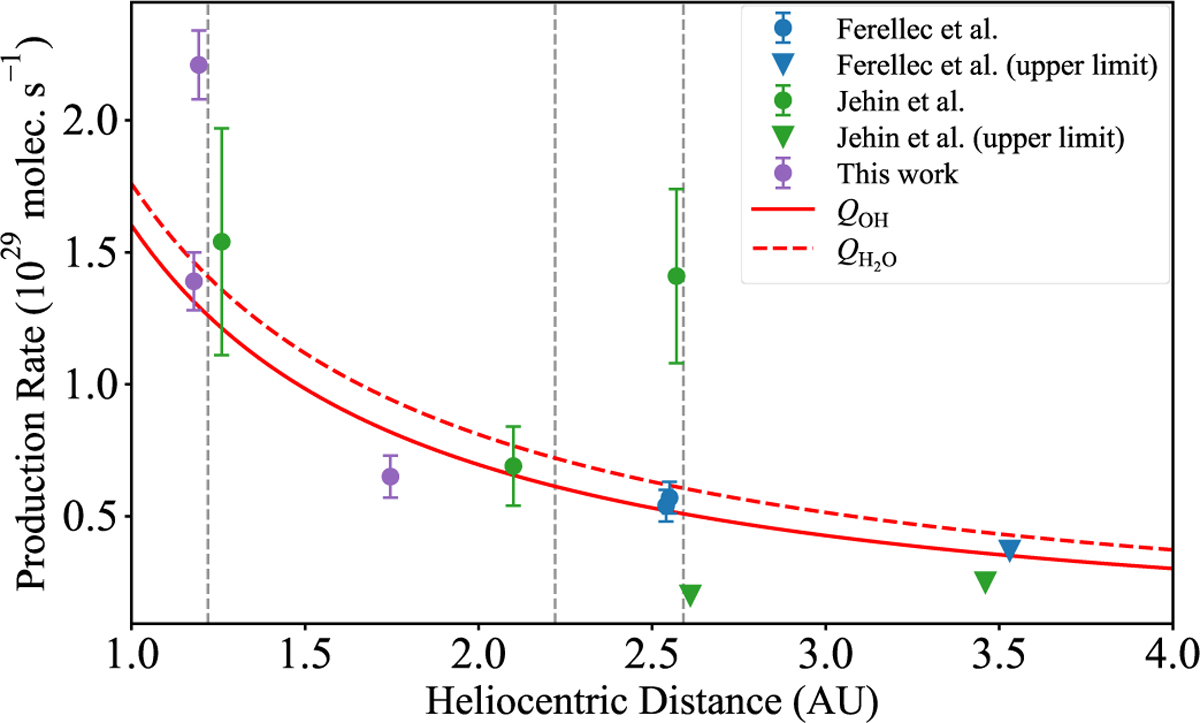
Fig. 4
Download original image
OH production rates of comet 12 P as a function of heliocentric distance. The measurements from different sources are shown with different symbols. Error bars represent 1 σ uncertainties, and triangles indicate upper limits. The solid red line shows the best power-law fit, excluding data from immediately after the outbursts on November 14 and February 29 (marked by dashed gray lines). The dashed red line indicates the curve of the water production rate inferred by the OH curve.
Current usage metrics show cumulative count of Article Views (full-text article views including HTML views, PDF and ePub downloads, according to the available data) and Abstracts Views on Vision4Press platform.
Data correspond to usage on the plateform after 2015. The current usage metrics is available 48-96 hours after online publication and is updated daily on week days.
Initial download of the metrics may take a while.