| Issue |
A&A
Volume 701, September 2025
|
|
|---|---|---|
| Article Number | A204 | |
| Number of page(s) | 9 | |
| Section | Planets, planetary systems, and small bodies | |
| DOI | https://doi.org/10.1051/0004-6361/202554867 | |
| Published online | 17 September 2025 | |
Pre-perihelion radio observations of comet 12P/Pons-Brooks with the Tianma Radio Telescope
1
Key Laboratory of Planetary Sciences, Purple Mountain Observatory, Chinese Academy of Sciences,
Nanjing
210023,
China
2
School of Astronomy and Space Science, University of Science and Technology of China,
Hefei
230026,
China
3
Shanghai Astronomical Observatory, Chinese Academy of Sciences,
80 Nandan Road,
200030
Shanghai,
PR China
4
Instituto de Estudios Astrofísicos, Facultad de Ingeniería y Ciencias, Universidad Diego Portales,
Santiago,
Chile
5
Planetary Environmental and Astrobiological Research Laboratory (PEARL), School of Atmospheric Sciences, Sun Yat-sen University,
Zhuhai,
China
6
Key Laboratory of Radio Astronomy, Xinjiang Astronomical Observatory, Chinese Academy of Sciences,
Urumqi,
Xinjiang
830011,
China
7
Key Laboratory of Optical Astronomy, National Astronomical Observatories, Chinese Academy of Sciences,
Beijing
100101,
China
★ Corresponding authors: This email address is being protected from spambots. You need JavaScript enabled to view it.
; This email address is being protected from spambots. You need JavaScript enabled to view it.
Received:
30
March
2025
Accepted:
5
August
2025
Abstract
Context. The multiple outburst events of comet 12P/Pons-Brooks during its 2024 apparition offer a unique window into highly active volatile releasing processes not observable during quiescent periods. Radio observations are capable of measuring specific cometary gas species, providing valuable insights into the chemical composition and activity mechanism of comets.
Aims. We performed radio observations of comet 12P/Pons-Brooks with the Tianma 65 m Radio Telescope, targeting the OH and NH3 inversion lines at 18 and 1.3 cm, respectively. By monitoring 12P at different heliocentric distances on its inbound journey, we aim to provide insights into the comet's volatile composition and outburst behavior.
Methods. Four observations were carried out between December 2023 and March 2024, when the comet was approaching the Sun from 2.22 to 1.18 AU. We conducted 18 cm OH lines observations on four separate days using the cryogenically cooled receiver system of the telescope to derive the H2O production rate. During 12P's outburst on December 14, we also conducted observations targeting the NH3 emission.
Results. OH 18 cm lines were clearly detected with a signal-to-noise ratio of ∼4 σ (peak intensity), yielding estimates on corresponding water production rates of approximately 1029 molec. s−1. A tentative detection of NH3 was made at the ∼3 σ level during the outburst phase, but the detection needs to be verified.
Conclusions. Our observations provide information on the outgassing behavior of 12P/Pons-Brooks during its 2024 apparition. The water production rate of 12P, derived from the 18 cm OH lines, is consistent with measurements obtained in other works. The possible detection of NH3 during an outburst suggests possible connections between the subsurface volatile reservoir and the outburst mechanism. These results could further our understanding of the composition and activity of Halley-type comets.
Key words: methods: observational / comets: general / comets: individual: 12P/Pons-Brooks
© The Authors 2025
 Open Access article, published by EDP Sciences, under the terms of the Creative Commons Attribution License (https://creativecommons.org/licenses/by/4.0), which permits unrestricted use, distribution, and reproduction in any medium, provided the original work is properly cited.
This article is published in open access under the Subscribe to Open model. This email address is being protected from spambots. You need JavaScript enabled to view it. to support open access publication.
1 Introduction
Comets, as primitive remnants of the early Solar System, serve as crucial probes into the physical and chemical conditions that prevailed during the formation of our planetary system (Huebner 2009). These “cosmic fossils” have preserved pristine materials from the protosolar nebula, including ices, organics, and dust, largely unaltered since their formation about 4.6 billion years ago (Mumma & Charnley 2011). The study of cometary composition and activity not only provides insights into the chemical inventory and temperature conditions in the early Solar System, but also helps trace the origin and evolution of volatile elements on Earth (Altwegg et al. 2019).
When comets approach the planet region of the Solar System, solar heating triggers the sublimation of their volatile components, primarily water ice, leading to the development of a coma and characteristic tails. This process, known as outgassing, releases various molecular species that can be observed via different techniques. Radio astronomy has emerged as a powerful technique for investigating cometary molecular species through their rotational transitions (Bockelée-Morvan et al. 2004; Bockelée-Morvan & Biver 2017).
Comet 12P/Pons-Brooks (hereafter 12P), discovered independently by Jean-Louis Pons in 1812 and William Brooks in 1883, is a Halley-type comet (HTC) with an orbital period of 71.3 years. Numerical integration suggests that the comet has not experienced significant gravitational perturbations in the past ∼1000 years and has retained a relatively stable orbit (Meyer et al. 2020). The most intriguing characteristic of 12P is its recurring intensive outbursts, as recorded during each of its apparitions since 1883 (Kronk 2003, 2009; Porter 1955; Chandler 1884). Sublimation of super-volatile ices might cause such a phenomenon, but the detailed mechanism is still unclear. The OH 18 cm lines, resulting from the Λ-doubling transitions in the ground state of the OH radical, have been widely used as a proxy to determine water production rates in comets (Crovisier et al. 2002). These lines are particularly valuable because they are observable from the ground and provide reliable measurements of the water production rate, which is crucial for understanding cometary activity. The OH radicals are primarily produced through water photodissociation, with a nearly 90% branching ratio (Huebner et al. 1992).
Ammonia (NH3) is another important volatile species in comets, typically present at an abundance of ∼0.1−3.6% relative to water (Drozdovskaya et al. 2023). Direct detection of NH3 in comets is relatively rare due to its short photodissociation lifetime, low abundance, and weak intrinsic line strengths. Observations of the inversion lines at 1.3 cm wavelengths are especially scarce. These lines have been detected in comets C/1983 H1 (IRAS-Araki-Alcock) (Altenhoff et al. 1983), C/1996 B2 (Hyakutake) (Palmer et al. 1996), and C/1995 O1 (Hale-Bopp) (Bird et al. 1997; Hirota et al. 1999), and have not been detected in comets C/2001 A2 (LINEAR), C/2001 Q4 (NEAT), C/2002 T7 (LINEAR), or 153P/Ikeya-Zhang (Bird et al. 2002; Hatchell et al. 2005). Among these results, the (3, 3) transition is the most frequently detected and the strongest line of the five transitions. In the infrared domain, particularly around 3 μ m, numerous NH3 detections have been reported despite the challenges posed by relatively weak line strengths and spectral blending with other molecular species (Dello Russo et al. 2016). The fundamental rotational transition (1, 0) →(0, 0) at 572 GHz is only accessible from space, and valuable measurements were obtained by the Odin and Herschel satellites (Biver et al. 2012). This same transition was crucial for monitoring NH3 in comet 67P/C-G using the Microwave Instrument for the Rosetta Orbiter (MIRO) during the Rosetta mission (Biver et al. 2019). However, during outbursts, increased production of NH3 may provide opportunities for ground-based detections.
In 2020, 12P was detected at a heliocentric distance of 11.89 AU as it was making the latest inbound journey to the inner Solar System (Ye et al. 2020). During its apparition in 2024, the comet experienced several major and minor outbursts (Jewitt & Luu 2025). Table 1 shows the outbursts of 12P and the changes in brightness in 2023–2024; the most prominent outbursts in July and November are readily recognizable. Following the huge outburst that brightened the comet by 5 mag on July 19, 2023, the activity of 12 P has remained at a relatively high level with an outburst every few weeks. Following the initial outburst, sustained brightening was observed, peaking around October 5, 2023, and November 14, 2023. 12P reached perihelion at a distance of 0.78 AU from the Sun on April 21, 2024, and became a naked-eye comet, whose activity grew stronger.
In this paper we present radio observations of comet 12P using the Tianma 65 m Radio Telescope (TMRT), focusing on both OH 18 cm lines and 1.3 cm NH3 emission. Our observations span from December 2023 to March 2024, bracketing a significant outburst on December 14. With these observations we aim to (i) determine the water production rate and its temporal variations, (ii) investigate the presence of NH3 during the outburst, and (iii) improve our understanding of the relationship between outbursts and the volatile composition in HTCs.
The paper is organized as follows: Section 2 describes our observations and data reduction procedures. The results are presented in Sect. 3, which is followed by a discussion in Sect. 4. Our conclusions are summarized in Sect. 5.
Pre-perihelion outbursts of comet 12P.
2 Observations and data reduction
Observations in the L band and K band centered at the 18 cm OH lines and the 1.3 cm NH3 lines, respectively, were carried out on four days, approximately 5 hours each day, between December 2023 and March 2024 using TMRT of Shanghai Astronomical Observatory in Shanghai, China (Liu et al. 2024; Du et al. 2024). The frequencies were obtained from the Jet Propulsion Laboratory (JPL) spectral catalog1 (Pickett et al. 1998). Observational parameters are provided in Table 2.
The L-band receiver of TMRT employs a cryogenically cooled dual-polarization system (Li et al. 2015). The system temperature is typically 20−30 K under good weather conditions (Wang et al. 2015). The beam size is approximately 11.6 arcmin at 1.6 GHz, with an aperture efficiency of about 50%. The receiver system includes a noise calibration unit and a temperature monitoring system (Yan et al. 2015; Li et al. 2016). The K-band receiver features a dual-polarization cryogenic receiver system. The typical system temperature is around 160 K in good weather. The beam size is approximately 50 arcseconds at 24 GHz, with an aperture efficiency of about 50%. The system employs a temperature-stabilized noise calibration unit and includes a water vapor radiometer for atmospheric calibration. The pointing accuracy is better than 5 arcseconds under normal conditions (Wang et al. 2017). The digital backend system (DIBAS) of TMRT offers 29 different spectral modes, divided into single-window and multi-window configurations. The single-window modes include broadband options (Modes 1–3) with up to 1.5 GHz bandwidth and 16 384 channels, and narrowband options (Modes 4–19) achieving frequency resolutions as fine as 0.02 kHz. The multi-window modes (Modes 20–29) provide eight independent windows of 24 or 16 MHz bandwidth that can be flexibly positioned within the receiving band, with frequency resolutions up to 0.24 kHz, enabling efficient simultaneous observations of multiple spectral lines with high spectral resolution in the L to Q bands (Li et al. 2015).
For K-band observations on December 14, 2023, we employed DIBAS mode 20, which provides eight spectral windows, each featuring 4096 channels across a 23.4 MHz bandwidth. This configuration yielded a velocity resolution of approximately 0.07 km s−1 at 24 GHz. L-band observations utilized DIBAS mode 24, also with eight spectral windows, but with enhanced spectral resolution using 65536 channels per 23.4 MHz bandwidth window, achieving a velocity resolution of about 0.06 km s−1 at 1.6 GHz.
Single-point position-switching observations were conducted under favorable weather conditions. The brightness temperature of the main beam (TMB) was derived from the antenna temperature (T*A) using TMB=T*A/ηB, where ηB ∼60% represents the main beam efficiency. Prior to each observing session, pointing accuracy and system performance were verified using bright calibrator sources (e.g., W49N). The conversion factor was 1.66 Jy K−1 under 50% aperture efficiency from the antenna temperature T*A to the flux density S (Zhang et al. 2022).
Data reduction and analysis were performed using the CLASS package2 within GILDAS software suite. The data processing pipeline included Doppler correction to account for the comet's radial velocity relative to the telescope during the observation period (as listed in Table 2). The spectral analysis was confined to the right circular polarization data, as the left circular polarization measurements were compromised by much more radio frequency interference in the L band. Linear baselines were subtracted from each spectrum, excluding the emission line region. Individual spectra were then averaged with their rms noise levels as the weights. We verified that the baseline fitting procedure had negligible impact on the spectral line parameters within our narrow frequency windows.
Observational parameters of 12P.
3 Results
The observed spectra of the 18 cm OH and 1.3 cm NH3 lines are shown in Figs. 1 and 2. Spectra are aligned on the velocity scale. For 18 cm OH lines, the main 1665 and 1667 MHz lines were clearly detected with a signal-to-noise ratio (S/N) above 4 σ (see details in Table 3). For the five NH3 lines at 1.3 cm, only (3, 3) was tentatively detected at an S/N of about 3 σ (see details in Table 5).
The expected statistical relative intensities of the 1667:1665 MHz lines are 9:5 (1.8) under local thermal equilibrium, which is in good agreement with the observations (1.6–2.1). We analyzed the OH spectral line profiles with a Gaussian fit, and obtained the full width at half maximum (FWHM) and the Doppler shift relative to the reference frame of the cometary nucleus. The integrated intensity was obtained from the velocity interval [−2, 2] km s−1([−2.5,+2.5] km s−1. on March 2 for the broader line profile), and the error was calculated from equation  RMS × d v, where d v is the channel width and n is the number of channels that span the line. The 3 σ upper limit of the NH3 line intensities were obtained considering velocity interval [−1.5, 1.5] km s−1. The NH3(3, 3) line area was also obtained from a Gaussian fit. Their values are summarized in Tables 3 and 5.
3.1 Hydroxyl data analysis
3.1.1 Outgassing pattern
The OH line profiles observed on January 20 exhibited notable asymmetry, characterized by a distinct narrow feature at approximately −0.3 km s−1 in both the 1665 and the 1667 MHz transitions. This asymmetric structure can be primarily attributed to the presence of a jet directed toward both Earth and the Sun, taking into account the small phase angle (<30°) observed during this period. The profiles became more symmetric as 12P moved closer to the Sun in March.
The observed line profiles were analyzed using the trapezoid model, which has been widely applied in radio observations of cometary OH lines (e.g., Crovisier et al. 2002). The OH velocity (vOH), comprising both the parent molecules outflow velocity (vp; e.g., H2O) and the ejection velocity (ve), was derived from fitting a symmetric trapezoidal profile to the spectral line (Fig. 3). Under the assumption of monokinetic velocity distributions for both the parent molecule and OH ejection, the maximum radial velocity of OH along the line of sight is vp+ve corresponding to the half-width of the trapezoid's lower base (Bockelée-Morvan et al. 1990). The asymmetry in OH line profiles is a common characteristic in comets, primarily attributed to anisotropic outgassing patterns (Bockelée-Morvan & Gerard 1984). While this asymmetry has minimal impact on the lower base of the fitting trapezoid (vp+ve), it may lead to an underestimate of vp (Bockelée-Morvan et al. 1990). Although the FWHM derived from Gaussian fitting provides an alternative measure of velocity (Table 3), determining vp from the half-power width presents significant challenges for the daughter molecule spectral lines. This limitation was particularly evident in our January 20 observations, where the pronounced asymmetry in the line profile resulted in a notably larger discrepancy between the FWHM values obtained from Gaussian and trapezoidal fitting methods compared to other observation dates. To address these uncertainties and facilitate the determination of vp, we adopted a standard value of 0.9 km s−1 for ve, which is consistent with the typical values observed in cometary studies (Bockelée-Morvan et al. 1990). The derived values are presented in Table 4. vp exhibited significant temporal variations throughout the observation period. Initially, vp measured approximately 0.5 km s−1 when the comet was at a heliocentric distance of 1.75 AU. About two days following the February 29 mini-outburst, the measured velocity reached 1.4 kms−1. This represents a high value at heliocentric distances (rh) of 1.1–1.3 AU, considering the corresponding OH production rate (Tseng et al. 2007). A lower value of 0.95 km s−1 was measured the next day.
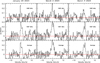 |
Fig. 1 Averaged 18 cm OH lines of 12 P observed on three separate days: January 20 (left), March 2 (middle), and March 3 (right), 2024. Top and middle: 1665 and 1667 MHz lines, respectively. Bottom: weighted averages of the 1667 and 1665 MHz lines scaled to 1667 MHz, assuming the statistical ratio of 1.8. The vertical scale is the main beam brightness temperature, and the horizontal scale is the Doppler velocity in the comet rest frame. The frequency resolution is 0.0014 MHz, corresponding to a velocity resolution of 0.2575 km s−1 after smoothing. We list the fitting results in Tables 3 and 4. |
18 cm OH spectral characteristics of 12P.
3.1.2 Production rate and evolution
The OH 18 cm lines (1665/1667 MHz) in comets exhibit complex behavior due to the interaction between the OH radicals and the solar radiation field (Despois et al. 1981; Schleicher & A'Hearn 1988). The ground-state 2 Π3/2 Λ-doublet populations of OH are primarily determined by the solar UV pumping and collisional effects (Elitzur 1981; Schleicher & A'Hearn 1982). The OH 18 cm lines act as a weak maser, with the population inversion of the Λ-doublet primarily controlled by the comet's heliocentric velocity (vh) due to Doppler-shifted solar UV excitation. In the inner coma regions of productive comets, collisional excitation dominates, equalizing the Λ-doublet level populations and quenching the maser inversion to zero (Despois et al. 1981; Gerard 1990).
The quenching radius (rq) defines the spherical region where maser quenching occurs, determined by the collision rate and then the number density of collisional partners (which is directly related to the water production rate here; Schleicher & A'Hearn 1988; Crovisier & Schloerb 1991). Inside rq, the OH radio lines are quenched, while outside rq, the lines maintain their normal emission characteristics. This effect creates a shell-like structure in the OH radio emission distribution, with reduced emission in the inner coma (Gérard et al. 1998). The quenching phenomenon must be carefully considered when deriving OH production rates from radio observations, as it can lead to significant underestimation of the OH abundance if not properly accounted for in the analysis (Crovisier 1989; Bockelée-Morvan et al. 2004).
The number of unquenched OH radicals in the coma within the field of view (FOV) Γ can be expressed as (Schloerb & Gerard 1985)
![Mathematical equation: $\Gamma_{\mathrm{OH}}(\text { unquenched })=\frac{4 \pi \Delta^{2} \nu S}{A_{\mathrm{ul}} k c T_{\mathrm{bg}}} \frac{8}{2 F_{\mathrm{u}}+1} /\left[i+\frac{i+1}{2} \frac{h \nu}{k T_{\mathrm{bg}}}\right],$](/articles/aa/full_html/2025/09/aa54867-25/aa54867-25-eq2.png) (1)
where Aul is the Einstein spontaneous coefficient of the line at frequency v(Aul=7.1 × 10¹¹ s−1. and 7.7 × 10¹¹ s−1 for the 1665 and 1667 MHz lines, respectively; Wilson et al. 2013), Fu is the statistical weight of the upper level of the transition (Fu=1 and 2 for the 1665 and 1667 MHz lines, respectively), i is the inversion of the ground state Λ-doublet levels listed in Table 4, Tbg is the background temperature, and Δ is the Earth-comet distance. Equation (1) was then simplified by Bockelée-Morvan et al. (1990) to
(1)
where Aul is the Einstein spontaneous coefficient of the line at frequency v(Aul=7.1 × 10¹¹ s−1. and 7.7 × 10¹¹ s−1 for the 1665 and 1667 MHz lines, respectively; Wilson et al. 2013), Fu is the statistical weight of the upper level of the transition (Fu=1 and 2 for the 1665 and 1667 MHz lines, respectively), i is the inversion of the ground state Λ-doublet levels listed in Table 4, Tbg is the background temperature, and Δ is the Earth-comet distance. Equation (1) was then simplified by Bockelée-Morvan et al. (1990) to
 (2)
f=ΓOH (unquenched)/ΓOH (total) is the fraction of the OH radicals at fluorescence equilibrium, which should be 1 for no collisional quenching effect when the field of view (FOV) is much larger than the size of the OH coma. Under our observation conditions, the FOV is 4–5 times larger than the scalelength of OH, LOH=vOH τOH, even when we assume an velocity of 1.4 km s−1 · τOH is the OH lifetime, 1.1 × 10⁵ s at 1 AU (Gerard 1990; Crovisier et al. 2002) with τOH=τOH(1AU)·
(2)
f=ΓOH (unquenched)/ΓOH (total) is the fraction of the OH radicals at fluorescence equilibrium, which should be 1 for no collisional quenching effect when the field of view (FOV) is much larger than the size of the OH coma. Under our observation conditions, the FOV is 4–5 times larger than the scalelength of OH, LOH=vOH τOH, even when we assume an velocity of 1.4 km s−1 · τOH is the OH lifetime, 1.1 × 10⁵ s at 1 AU (Gerard 1990; Crovisier et al. 2002) with τOH=τOH(1AU)·  . For the calculation of f, the spatial distribution of OH radicals is described by the Haser model (Haser 1957):
 (3)
Here Qp is the production rate of water, the assumed primary parent molecule of OH. By adopting the branching ratio of OH, we could derive 12P's water production rate as QH2O=1.1 QOH. Similarly, the lifetime of H2O τH2O=8.5 × 10⁴ s at 1 AU was used to calculate Lp(Lp=vp τH2O). Details of vp and vOH are provided in Sect. 3.1.1. The OH production rate QOH can be derived from ΓOH as
(3)
Here Qp is the production rate of water, the assumed primary parent molecule of OH. By adopting the branching ratio of OH, we could derive 12P's water production rate as QH2O=1.1 QOH. Similarly, the lifetime of H2O τH2O=8.5 × 10⁴ s at 1 AU was used to calculate Lp(Lp=vp τH2O). Details of vp and vOH are provided in Sect. 3.1.1. The OH production rate QOH can be derived from ΓOH as
 (4)
For the determination of QOH, we assumed an inversion i=0 within the region r<rq. Following Gerard (1990) and Gérard et al. (1998), the quenching radius (in km) is related to the production rate and heliocentric distance as follows:
(4)
For the determination of QOH, we assumed an inversion i=0 within the region r<rq. Following Gerard (1990) and Gérard et al. (1998), the quenching radius (in km) is related to the production rate and heliocentric distance as follows:
 (5)
where
(5)
where  = 47 000 km. An iterative method that simultaneously solves for both QOH and rq was used. The calculation takes into account the Gaussian beam profile of the radio telescope and uses both spherical and cylindrical volume integrations to determine the number of OH radicals in different regions (e.g., Despois et al. 1981; Drozdovskaya et al. 2023).
The OH production rates derived from our observations show a clear temporal evolution from January to March 2024. Starting at a relatively low rate of QOH= (0.65 ± 0.08) × 1029 molec. s−1 on January 20, the production increased significantly to reach a maximum of QOH= (2.21 ± 0.13) × 1029 molec. s−1 on March 2, followed by a decrease to QOH=(1.39 ± 0.11) × 1029 molec. s−1 on March 3 (listed in Table 4). This variation represents nearly a factor of 3 increase in activity over approximately six weeks, followed by a ∼37% decrease in just one day. The variation observed between March 2 and 3 is possibly related to the February 29 outburst. The production rates calculated using the Schleicher & A'Hearn (1988) inversion method are systematically higher by about 9−10% compared to those derived using the Despois et al. (1981) method, but the two show the same temporal trend.
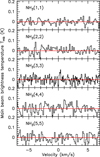 |
Fig. 2 Averaged 1.3 cm NH3 lines of 12 P observed on December 14, 2023. From top to bottom, they are NH3(1, 1) to (5, 5). The frequency resolution of NH3(3, 3) was 0.057 MHz (and about 0.0114 MHz for the other four lines), corresponding to a velocity resolution of 0.0719 km s−1 (about 0.14 km s−1 for the other four lines) after smoothing. |
3.2 Ammonia data analysis
Among the five metastable ammonia lines at 1.3 cm, only the strongest (3, 3) were detected. As discussed in Drozdovskaya et al. (2023), only the (2, 2) line competes in intensity with the (3, 3) line, taking the distribution of the hyperfine components into account. The narrow line width of the marginal NH3(3, 3)(∼0.11 km s−1) and the significant red Doppler shift (∼0.29 km s−1) are notable characteristics. This spectral signature is potentially consistent with outgassing directed away from the observer (e.g., a nightside jet), suggesting a more plausible expansion velocity of ∼0.4 km s−1.
The beam-averaged column density of NH3 in a given metastable (J, K=J) state can be calculated using the following equation (see details in Bird et al. 1997):
 (6)
where J and K are the rotational quantum numbers. The integral term represents the total intensity over a velocity range. The relationship between the beam-averaged column density and production rate from Snyder (1982, see also Bird et al. 1997) was used to estimate NH3 production rate when the ammonia coma region is much smaller than the FOV:
(6)
where J and K are the rotational quantum numbers. The integral term represents the total intensity over a velocity range. The relationship between the beam-averaged column density and production rate from Snyder (1982, see also Bird et al. 1997) was used to estimate NH3 production rate when the ammonia coma region is much smaller than the FOV:
 (7)
where Δ is the geocentric distance and θ is the half-power beam width of the antenna. Considering the lifetime of NH3 was about 5.56 × 10³ s at 1 AU (the average value for a quiet and an active Sun from Huebner & Mukherjee 2015) and the small NH3 outgassing velocity suggested by the NH3(3, 3) line profile (about 0.3 ± 0.1 km s−1 from the Doppler shift and FWHM), the ammonia coma region was much smaller than the width of the projected antenna beam. To roughly estimate the NH3 production rate, we assumed a Boltzmann distribution for the level population n(J, K=J)=〈 N(J, K=J)〉 /〈 N(NH3)〉 and used the value for a rotational temperature of 60 K, as given by Bird et al. (1997) and used by Palmer et al. (1996). The production rate and column density are given in Table 6.
(7)
where Δ is the geocentric distance and θ is the half-power beam width of the antenna. Considering the lifetime of NH3 was about 5.56 × 10³ s at 1 AU (the average value for a quiet and an active Sun from Huebner & Mukherjee 2015) and the small NH3 outgassing velocity suggested by the NH3(3, 3) line profile (about 0.3 ± 0.1 km s−1 from the Doppler shift and FWHM), the ammonia coma region was much smaller than the width of the projected antenna beam. To roughly estimate the NH3 production rate, we assumed a Boltzmann distribution for the level population n(J, K=J)=〈 N(J, K=J)〉 /〈 N(NH3)〉 and used the value for a rotational temperature of 60 K, as given by Bird et al. (1997) and used by Palmer et al. (1996). The production rate and column density are given in Table 6.
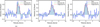 |
Fig. 3 Averaged 18 cm OH lines (scaled to 1667 MHz) of 12 P obtained in three observations with both a Gaussian and a trapezoid fit: January 20 (a), March 2 (b), and March 3 (c). |
Averaged spectral characteristics of 18 cm OH lines and the production rate in 12P.
1.3cm NH3 spectral characteristics of 12P.
Ammonia production rate and column density in 12 P.
4 Discussion
4.1 Evolution of water production rates
Figure 4 illustrates the variation of OH production rates in comet 12 P with respect to heliocentric distance. The data points are compiled from different sources: Ferellec et al. (2024), Jehin et al. (2023a,b, 2024), and our current work. A power-law fit (shown as a solid red line) was applied to the non-outburst data, yielding the relationship QOH = (1.60 ± 0.16)  × 1029 molec. s−1, corresponding to a water production rate variation QH2O = (1.76 ± 0.18)
  × 1029 molec. s −1 (dashed red line). The analysis of OH production rate dependence on heliocentric distance reveals significant variations among different dynamical populations of comets, with the power-law exponent serving as a critical parameter for characterizing these variations. Our analysis shows that 12 P shows a relatively shallow power-law slope of −1.2 based on data from 4.0 to 1.0 AU inbound, which is closer to the taxonomic class of depleted long period comets according to Combi et al. (2019). Dynamical families show a clear progression in power-law steepness: Long-period comets (LPCs; including young, old, and dynamically new comets) exhibit the flattest pre-perihelion exponents with a mean value of −2.32 (range: −7.8 to −0.5), while Jupiter-family comets (JFCs) display much steeper slopes averaging −4.14 (range: −0.4 to −11.9). HTCs show intermediate behavior with a steep average exponent of −4.38 according to A'Hearn et al. (1995). Notably, 12P exhibited exceptionally high activity near perihelion, with its water production rate reaching 1030 molec. s−1 that results in a steeper power-law index of −3 (Combi et al. 2024). This significant change in its power-law index could be linked to its physical and dynamical properties.
The relatively flat power-law exponent observed for 12P has important implications for understanding its physical properties. This behavior might reflect distinctive characteristics in surface morphology, distribution of active regions, or compositional properties of volatile reservoirs within the nucleus. The moderate heliocentric dependence suggests that 12P maintains relatively efficient outgassing processes even at larger heliocentric distances compared to typical HTCs. Such behavior warrants further investigation to determine whether it represents a transitional evolutionary state between LPCs and HTCs or a unique compositional signature.
4.2 The active area
To further investigate the comet's evolving activity, we calculated the minimum active area corresponding to the water production rates using a sublimation model3 (Cowan & A'Hearn 1979). We set obliquity =0° to maximize the sublimation averaged over the entire surface and hence obtained a lower limit for the total active area. We further assumed an albedo of 0.04 and an infrared emissivity of 100% (Xing et al. 2020). The resulting minimum active areas Amin in our work were about 99 ∼122 km2 on March 2 during an outburst and decreased to about 61 ∼75 km2 on the next day. If we use the fitted powerlaw function results and account for long-term variations during pre-perihelion (excluding outburst periods), the minimum active area of 12P stabilizes at about 70 km2.
Under the assumption of a fully active surface (active fraction of 100%), a lower limit for the nuclear radius of  was derived from the peak active area observed on March 3, 2024, less affected by an outburst. Ye et al. (2020) calculated a larger radius of 17 ± 6 km, which likely represents an upper limit due to uncorrected contamination from cometary dust and gas emissions.
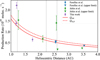 |
Fig. 4 OH production rates of comet 12 P as a function of heliocentric distance. The measurements from different sources are shown with different symbols. Error bars represent 1 σ uncertainties, and triangles indicate upper limits. The solid red line shows the best power-law fit, excluding data from immediately after the outbursts on November 14 and February 29 (marked by dashed gray lines). The dashed red line indicates the curve of the water production rate inferred by the OH curve. |
4.3 Abundance of ammonia
The NH3/H2O abundance ratio in comets measured so far shows a wide range of values, ranging from 0.1 to 2.0% across different cometary families (Kawakita & Mumma 2011; DiSanti et al. 2016). Notably, NH3 is among the molecules whose production ratio with water exhibits a correlation with heliocentric distance. Recent observations of both JFCs and Oort cloud comets have revealed this behavior (Fig. 7 of Drozdovskaya et al. 2023), suggesting that the production mechanism of NH3 might be more complex than direct sublimation from the nucleus. The observed variations could be attributed to different formation conditions in the early Solar System (Mumma & Charnley 2011), heterogeneous distribution within the nucleus (McKay et al. 2019), or secondary production mechanisms in the coma (Feldman et al. 2004). The recent discovery of ammonium salts  on cometary dust grains has revealed a significant reservoir of nitrogen in comets (Altwegg et al. 2020). These semi-volatile compounds, especially
  , with sublimation temperatures of 160−230 K, decompose to produce NH3 as a primary product (Hänni et al. 2019). This mechanism might explain the observed increase in NH3/H2O ratios as comets approach perihelion, as demonstrated through IR spectroscopic observations of multiple comets (Dello Russo et al. 2016). It appears that the detection of ammonia production at large perihelion distances is primarily from the ice in comet nucleus as the temperature of the dust particles is not high enough for salts sublimation.
We used the previously obtained power-law function between OH production rate and heliocentric distance in Sect. 4.1 to calculate the theoretical water production rate during the NH3 observation period. Since the comet was in outburst on that day, we doubled the inferred value on the basis of Jehin et al. (2024), who report that QCN increased by a factor of 2 following the outburst. The derived NH3/H2O ratio of 12 P at 2.22 AU is (1.36 ± 0.34)% using the estimated water production rate of 1.4 × 1029 molec s −1. Because the NH3 data were acquired during an outburst event, the abundance of ammonia is uncertain and is possibly overestimated.
At similar heliocentric distance, there was only one observation in the JFC 17P/Holmes, and the NH3/H2O ratio was (0.82 ± 0.52)% at 2.45 AU (Lippi et al. 2021). For a HTC like 12 P, observations of ammonia in the K band were even more limited. Bird et al. (1987) reported the K-band observations of ammonia in 1P/Halley with no detection. However, the NH3/H2O ratio in 1P/Halley was also estimated by the photodissociation products of ammonia (e.g., NH2, NH) from optical spectra (e.g., (0.20 ± 0.14)%; Wyckoff et al. 1991), ultraviolet spectra (0.44–0.94%; Feldman et al. 1993), Giotto spacecraft ion mass spectrometer (1−2%; Allen et al. 1987) and neutral mass spectrometer ( ; Meier et al. 1994). The ammonia abundance of another HTC, 8P/Tuttle, was (0.72 ± 0.38)% estimated by infrared high-resolution spectroscopy (see Fig. 5). Our derived NH3/H2O ratio places 12P among the higher end of observed ratios for its heliocentric distance, notably exceeding the 8 P/Tuttle measurement and comparable to active JFCs such as 9 P/Tempel 1(1.14 ± 0.72% at 1.51 AU), 10 P/Tempel 2(1.12 ± 0.24% at 1.44 AU) and LPCs such as C/2013 R1 (Lovejoy; 1.48 ± 0.28% at 1.32 AU). The NH3/H2O ratio measured in 12P beyond 2 AU appears relatively high (Fig. 5). However, as illustrated in the figure, only two points from the same dynamically new comet (DNC) C/2012 S 1 (ISON) exhibit elevated abundances at smaller heliocentric distances, whereas other comets show values concentrated below 2% without a pronounced trend. Actually, the observations beyond 1.5 AU are also not numerous enough to obtain a trend. This ambiguity complicates the assessment of heliocentric dependence and necessitates further observational verification. Nevertheless, it should be emphasized that our NH3 abundance estimate for 12P lacks contemporaneous water production measurements, which may introduce uncertainties. Moreover, it is critical to note that detection verification must take precedence before drawing definitive conclusions.
5 Conclusions
We used the TMRT to observe the HTC 12P in the L and K bands before perihelion, focusing on the OH radical and NH3, respectively, during the outburst periods. Our main conclusions are as follows:
The expansion velocities of water molecules, inferred from trapezoid fitting of OH line profiles, showed significant temporal variations. Assuming an ejection velocity of OH in the rest frame of H2 O, we obtained a lower expansion velocity of 0.5 km s−1 when the comet was at 1.75 AU. The expansion velocity decreased from 1.4 km s−1 to 1.0 km s−1 within two days in early March 2024, which was possibly related to the outburst on February 29.
The OH production rate exhibited variations that closely follow the pattern of expansion velocities. The production rates evolved from (0.65 ± 0.08) × 1029 molec. s−1 on January 20, 2024, peaked at (2.21 ± 0.13) × 1029 molec. s −1 on March 2, and subsequently decreased to (1.39 ± 0.11) × 1029 molec. s−1 on March 3.
The pre-perihelion OH production rate demonstrated a clear heliocentric dependence, following a power-law relationship with an index of −1.2 beyond 1 AU, which is relatively flat compared to the much steeper water curve immediately before perihelion.
We constrained the minimum active area of 12 P to be above 61 km2; this corresponds to a lower limit nuclear radius of 2.22 km.
We achieved a 3 σ detection of the NH3(3, 3) inversion line, which is characterized by an unusually narrow line width consistent with an expansion velocity of about 0.3 km s−1. The derived NH3/H2O ratio of (1.36 ± 0.34)% might be overestimated due to the possible underestimation of the water production rate.
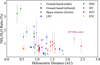 |
Fig. 5 NH3/H2O as a function of heliocentric distance updated from Drozdovskaya et al. (2023). The measurement in 1P/Halley was acquired by the Giotto space mission. We show Encke-type comets (ETCs), JFCs, LPCs originating from the Oort cloud, DNCs, and HTCs. |
Acknowledgements
We sincerely thank Dr. Dominique Bockelée-Morvan for providing constructive comments and valuable suggestions, which have greatly improved the quality of this work. The authors thank all the staff of the Tianma-65 m Radio Telescope at Shanghai Astronomical Observatory for their assistance. We thank Dr. Juan Li from Shanghai Astronomical Observatory for helpful suggestions in the noise assessment of observations. This work is financially supported by the National Natural Science Foundation of China (Grant Nos.12233003, 12173093 and 12033010), the science research grants from the China Manned Space Project with No. CMSCSST-2021-B08. We acknowledge the support of the Minor Planet Foundation of Purple Mountain Observatory, China.
References
- A'Hearn, M. F., Millis, R. C., Schleicher, D. O., Osip, D. J., & Birch, P. V., 1995, Icarus, 118, 223 [CrossRef] [Google Scholar]
- Allen, M., Delitsky, M., Huntress, W., Yung, Y., & Ip, W. H., 1987, A&A, 187, 502 [Google Scholar]
- Altenhoff, W. J., Batrla, W. K., Huchtmeier, W. K., et al. 1983, A&A, 125, L19 [NASA ADS] [Google Scholar]
- Altwegg, K., Balsiger, H., & Fuselier, S. A., 2019, ARA&A, 57, 113 [NASA ADS] [CrossRef] [Google Scholar]
- Altwegg, K., Balsiger, H., Hänni, N., et al. 2020, Nat. Astron., 4, 533 [NASA ADS] [CrossRef] [Google Scholar]
- Bird, M. K., Huchtmeier, W. K., von Kap-Herr, A., Schmidt, J., & Walmsley, C. M., 1987, in Cometary Radio Astronomy, eds. W. M. Irvine, F. P. Schloerb, & L. E. Tacconi-Garman (USA: NATO), 85 [Google Scholar]
- Bird, M. K., Huchtmeier, W. K., Gensheimer, P., et al. 1997, A&A, 325, L5 [NASA ADS] [Google Scholar]
- Bird, M. K., Hatchell, J., van der Tak, F. F. S., Crovisier, J., & Bockelée-Morvan, D., 2002, ESA SP, 500, 697 [NASA ADS] [Google Scholar]
- Biver, N., Crovisier, J., Bockelée-Morvan, D., et al. 2012, A&A, 539, A68 [NASA ADS] [CrossRef] [EDP Sciences] [Google Scholar]
- Biver, N., Bockelée-Morvan, D., Hofstadter, M., et al. 2019, A&A, 630, A19 [NASA ADS] [CrossRef] [EDP Sciences] [Google Scholar]
- Bockelée-Morvan, D., & Biver, N., 2017, Phil. Trans. R. Soc. London Ser. A, 375, 20160252 [Google Scholar]
- Bockelée-Morvan, D., & Gerard, E., 1984, A&A, 131, 111 [Google Scholar]
- Bockelée-Morvan, D., Crovisier, J., & Gérard, E., 1990, A&A, 238, 382 [NASA ADS] [Google Scholar]
- Bockelée-Morvan, D., Crovisier, J., Mumma, M. J., & Weaver, H. A., 2004, in Comets II, eds. M. C. Festou, H. U. Keller, & H. A. Weaver (UA Press: The University of Arizona Press), 391 [Google Scholar]
- Chandler, S. C.Jr., 1884, Astron. Nachr., 107, 131 [Google Scholar]
- Combi, M. R., Mäkinen, T. T., Bertaux, J. L., Quémerais, E., & Ferron, S., 2019, Icarus, 317, 610 [NASA ADS] [CrossRef] [Google Scholar]
- Combi, M., Makinen, T., Bertaux, J.-L., Quemerais, E., & Ferron, S., 2024, AAS/Div. Planet. Sci. Meeting Abs., 56, 301.10 [Google Scholar]
- Cowan, J. J., & A'Hearn, M. F., 1979, Moon Planets, 21, 155 [NASA ADS] [CrossRef] [Google Scholar]
- Crovisier, J., 1989, A&A, 213, 459 [NASA ADS] [Google Scholar]
- Crovisier, J., & Schloerb, F. P., 1991, Astrophys. Space Sci. Lib., 167, 149 [Google Scholar]
- Crovisier, J., Colom, P., Gérard, E., Bockelée-Morvan, D., & Bourgois, G., 2002, A&A, 393, 1053 [NASA ADS] [CrossRef] [EDP Sciences] [Google Scholar]
- Dello Russo, N., Kawakita, H., Vervack, R. J., & Weaver, H. A., 2016, Icarus, 278, 301 [NASA ADS] [CrossRef] [Google Scholar]
- Despois, D., Gerard, E., Crovisier, J., & Kazes, I., 1981, A&A, 99, 320 [Google Scholar]
- DiSanti, M. A., Bonev, B. P., Gibb, E. L., et al. 2016, ApJ, 820, 34 [NASA ADS] [CrossRef] [Google Scholar]
- Drozdovskaya, M. N., Bockelée-Morvan, D., Crovisier, J., et al. 2023, A&A, 677, A157 [NASA ADS] [CrossRef] [EDP Sciences] [Google Scholar]
- Du, B., Zheng, Y., Liu, G., et al. 2024, Astron. Tech. Instrum., 1, 247 [Google Scholar]
- Elitzur, M., 1981, ApJ, 246, 354 [Google Scholar]
- Feldman, P. D., Fournier, K. B., Grinin, V. P., & Zvereva, A. M., 1993, ApJ, 404, 348 [Google Scholar]
- Feldman, P. D., Cochran, A. L., & Combi, M. R., 2004, in Comets II, eds. M. C. Festou, H. U. Keller, & H. A. Weaver (UA Press: The University of Arizona Press), 425 [Google Scholar]
- Ferellec, L., Opitom, C., Donaldson, A., et al. 2024, MNRAS, 534, 1816 [Google Scholar]
- Gerard, E., 1990, A&A, 230, 489 [Google Scholar]
- Gérard, E., Crovisier, J., Colom, P., et al. 1998, Planet. Space Sci., 46, 569 [CrossRef] [Google Scholar]
- Hänni, N., Gasc, S., Etter, A., et al. 2019, J. Phys. Chem. A, 123, 5805 [Google Scholar]
- Haser, L., 1957, Bulletin de la Société Royale des Sciences de Liège, 43, 740 [Google Scholar]
- Haslam, C. G. T., Wilson, W. E., Graham, D. A., & Hunt, G. C., 1974, A&AS, 13, 359 [NASA ADS] [Google Scholar]
- Hatchell, J., Bird, M. K., van der Tak, F. F. S., & Sherwood, W. A., 2005, A&A, 439, 777 [NASA ADS] [CrossRef] [EDP Sciences] [Google Scholar]
- Hirota, T., Yamamoto, S., Kawaguchi, K., Sakamoto, A., & Ukita, N., 1999, ApJ, 520, 895 [NASA ADS] [CrossRef] [Google Scholar]
- Huebner, W. F., 2009, in Origin and Early Evolution of Comet Nuclei, eds. H. Balsiger, K. Altwegg, W. Huebner, T. Owen, & R. Schulz (Berlin: Springer), 28, 5 [Google Scholar]
- Huebner, W. F., & Mukherjee, J., 2015, Planet. Space Sci., 106, 11 [Google Scholar]
- Huebner, W. F., Keady, J. J., & Lyon, S. P., 1992, Ap&SS, 195, 1 [NASA ADS] [CrossRef] [Google Scholar]
- Jehin, E., Donckt, M. V., Hmiddouch, S., & Manfroid, J. 2023a, ATel, 16338, 1 [Google Scholar]
- Jehin, E., Vander Donckt, M., Hmiddouch, S., et al. 2023b, ATel, 16282, 1 [Google Scholar]
- Jehin, E., Donckt, M. V., Hmiddouch, S., & Manfroid, J., 2024, ATel, 16498, 1 [Google Scholar]
- Jewitt, D., & Luu, J., 2025, AJ, 169, 338 [Google Scholar]
- Kawakita, H., & Mumma, M. J., 2011, ApJ, 727, 91 [NASA ADS] [CrossRef] [Google Scholar]
- Kelley, M. S. P., Usher, H., Lister, T., et al. 2023, ATel, 16254, 1 [Google Scholar]
- Kronk, G. W., 2003, Cometography A Catalog of Comets, 2, 1800 [Google Scholar]
- Kronk, G. W., 2009, Cometography A Catalog of Comets, 4, 1933 [Google Scholar]
- Li, J., Wu, Y. J., Qiao, H. H., Wang, J. Z., & Zuo, X. T., 2015, Acta Astron. Sinica, 56, 648 [Google Scholar]
- Li, J., Shen, Z.-Q., Wang, J., et al. 2016, ApJ, 824, 136 [Google Scholar]
- Lippi, M., Villanueva, G. L., Mumma, M. J., & Faggi, S., 2021, AJ, 162, 74 [NASA ADS] [CrossRef] [Google Scholar]
- Liu, Q., Shen, Z., Hong, X., et al. 2024, Astron. Tech. Instrum., 1, 239 [Google Scholar]
- Manzini, F., Oldani, V., Ochner, P., Bedin, L. R., & Reguitti, A., 2023, ATel, 16194, 1 [Google Scholar]
- McKay, A. J., DiSanti, M. A., Kelley, M. S. P., et al. 2019, AJ, 158, 128 [NASA ADS] [CrossRef] [Google Scholar]
- Meier, R., Eberhardt, P., Krankowsky, D., & Hodges, R. R., 1994, A&A, 287, 268 [NASA ADS] [Google Scholar]
- Meyer, M., Kobayashi, T., Nakano, S., & Green, D. W. E., 2020, arXiv e-prints [arXiv:2012.15583] [Google Scholar]
- Mumma, M. J., & Charnley, S. B., 2011, ARA&A, 49, 471 [NASA ADS] [CrossRef] [Google Scholar]
- Palmer, P., Wootten, A., Butler, B., et al. 1996, AAS Meeting Abstracts, 188, 62.12 [Google Scholar]
- Pickett, H. M., Poynter, R. L., Cohen, E. A., et al. 1998, J. Quant. Spec. Radiat. Transf., 60, 883 [Google Scholar]
- Porter, J. G., 1955, MNRAS, 115, 190 [Google Scholar]
- Remazeilles, M., Dickinson, C., Banday, A. J., Bigot-Sazy, M. A., & Ghosh, T., 2015, MNRAS, 451, 4311 [NASA ADS] [CrossRef] [Google Scholar]
- Schleicher, D. G., & A'Hearn, M. F., 1982, ApJ, 258, 864 [Google Scholar]
- Schleicher, D. G., & A'Hearn, M. F., 1988, ApJ, 331, 1058 [NASA ADS] [CrossRef] [Google Scholar]
- Schloerb, F. P., & Gerard, E., 1985, AJ, 90, 1117 [NASA ADS] [CrossRef] [Google Scholar]
- Snyder, L. E., 1982, Icarus, 51, 1 [Google Scholar]
- Tseng, W. L., Bockelée-Morvan, D., Crovisier, J., Colom, P., & Ip, W. H., 2007, A&A, 467, 729 [NASA ADS] [CrossRef] [EDP Sciences] [Google Scholar]
- Usher, H., Miles, R., Redondo, J. M. P., et al. 2023a, ATel, 16270, 1 [Google Scholar]
- Usher, H., Miles, R., Souza, M. d. O., et al. 2023b, ATel, 16229, 1 [Google Scholar]
- Wang, J. Q., Yu, L. F., Zhao, R. B., et al. 2015, Acta Astron. Sinica, 56, 63 [Google Scholar]
- Wang, J. Q., Yu, L. F., Jiang, Y. B., et al. 2017, Acta Astron. Sinica, 58, 37 [Google Scholar]
- Wilson, T. L., Rohlfs, K., & Hüttemeister, S., 2013, Tools of Radio Astronomy (Berlin: Springer) [Google Scholar]
- Wyckoff, S., Tegler, S. C., & Engel, L., 1991, ApJ, 368, 279 [Google Scholar]
- Xing, Z., Bodewits, D., Noonan, J., & Bannister, M. T., 2020, ApJ, 893, L48 [Google Scholar]
- Yan, Z., Shen, Z.-Q., Wu, X.-J., et al., ApJ, 2015, 814, 5 [Google Scholar]
- Ye, Q., Farnham, T. L., Knight, M. M., Holt, C. E., & Feaga, L. M., 2020, Res. Notes Am. Astron. Soc., 4, 101 [Google Scholar]
- Zhang, Y.-K., Chen, X., Sobolev, A. M., et al. 2022, ApJS, 260, 34 [NASA ADS] [CrossRef] [Google Scholar]
JPL spectral catalog: https://spec.jpl.nasa.gov
All Tables
Averaged spectral characteristics of 18 cm OH lines and the production rate in 12P.
All Figures
|
Fig. 1 Averaged 18 cm OH lines of 12 P observed on three separate days: January 20 (left), March 2 (middle), and March 3 (right), 2024. Top and middle: 1665 and 1667 MHz lines, respectively. Bottom: weighted averages of the 1667 and 1665 MHz lines scaled to 1667 MHz, assuming the statistical ratio of 1.8. The vertical scale is the main beam brightness temperature, and the horizontal scale is the Doppler velocity in the comet rest frame. The frequency resolution is 0.0014 MHz, corresponding to a velocity resolution of 0.2575 km s−1 after smoothing. We list the fitting results in Tables 3 and 4. |
| In the text | |
|
Fig. 2 Averaged 1.3 cm NH3 lines of 12 P observed on December 14, 2023. From top to bottom, they are NH3(1, 1) to (5, 5). The frequency resolution of NH3(3, 3) was 0.057 MHz (and about 0.0114 MHz for the other four lines), corresponding to a velocity resolution of 0.0719 km s−1 (about 0.14 km s−1 for the other four lines) after smoothing. |
| In the text | |
|
Fig. 3 Averaged 18 cm OH lines (scaled to 1667 MHz) of 12 P obtained in three observations with both a Gaussian and a trapezoid fit: January 20 (a), March 2 (b), and March 3 (c). |
| In the text | |
|
Fig. 4 OH production rates of comet 12 P as a function of heliocentric distance. The measurements from different sources are shown with different symbols. Error bars represent 1 σ uncertainties, and triangles indicate upper limits. The solid red line shows the best power-law fit, excluding data from immediately after the outbursts on November 14 and February 29 (marked by dashed gray lines). The dashed red line indicates the curve of the water production rate inferred by the OH curve. |
| In the text | |
|
Fig. 5 NH3/H2O as a function of heliocentric distance updated from Drozdovskaya et al. (2023). The measurement in 1P/Halley was acquired by the Giotto space mission. We show Encke-type comets (ETCs), JFCs, LPCs originating from the Oort cloud, DNCs, and HTCs. |
| In the text | |
Current usage metrics show cumulative count of Article Views (full-text article views including HTML views, PDF and ePub downloads, according to the available data) and Abstracts Views on Vision4Press platform.
Data correspond to usage on the plateform after 2015. The current usage metrics is available 48-96 hours after online publication and is updated daily on week days.
Initial download of the metrics may take a while.