Fig. 1.
Download original image
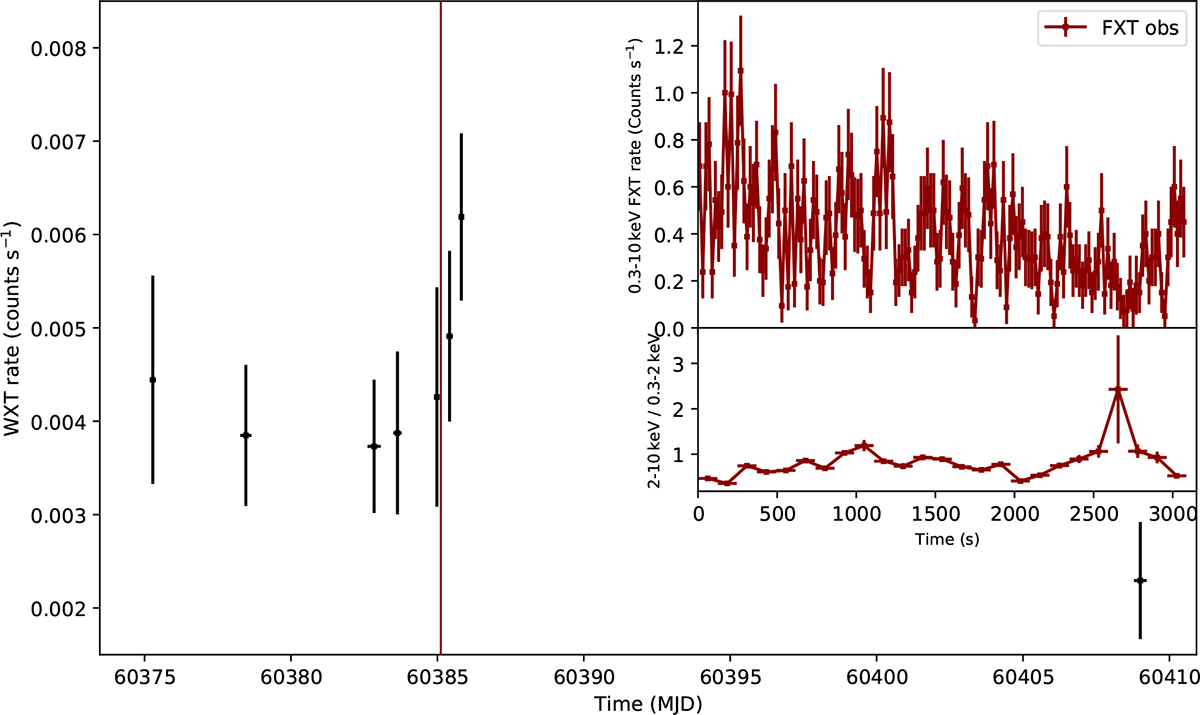
Light curves of EP J1154−5018. Main panel: Average count rates (black dots) of each observation by EP/WXT. The red vertical line indicates the start time of the EP/FXT observation. Inset: Light curve (with 20 s bin size) and hardness ratio (with 120 s bin size) of EP/FXT observation. The details of the observations can be found in Table 1.
Current usage metrics show cumulative count of Article Views (full-text article views including HTML views, PDF and ePub downloads, according to the available data) and Abstracts Views on Vision4Press platform.
Data correspond to usage on the plateform after 2015. The current usage metrics is available 48-96 hours after online publication and is updated daily on week days.
Initial download of the metrics may take a while.