| Issue |
A&A
Volume 701, September 2025
|
|
|---|---|---|
| Article Number | A19 | |
| Number of page(s) | 6 | |
| Section | Astrophysical processes | |
| DOI | https://doi.org/10.1051/0004-6361/202554876 | |
| Published online | 02 September 2025 | |
Einstein Probe discovery of the short-period intermediate polar EP J115415.8−501810
1
Key Laboratory of Particle Astrophysics, Institute of High Energy Physics, Chinese Academy of Sciences, Beijing, 100049, China
2
Institute of Space Sciences (ICE-CSIC), Campus UAB, C/ de Can Magrans s/n, Cerdanyola del Vallès, (Barcelona), 08193, Spain
3
Institut d’Estudis Espacials de Catalunya (IEEC), Esteve Terradas 1, RDIT Building, Of. 212 Mediterranean Technology Park (PMT), 08860 Castelldefels, Spain
4
INAF – Osservatorio Astronomico di Capodimonte, Salita Moiarello 16, 80131 Napoli, Italy
5
ESA/ESTEC, Noordwijk, 2201 AZ, The Netherlands
6
National Astronomical Observatories, Chinese Academy of Sciences, Beijing, 100101, PR China
7
School of Astronomy and Space Sciences, University of Chinese Academy of Sciences, Beijing, 100049, PR China
8
Department of Astronomy, Xiamen University, Xiamen, Fujian, 361005, China
9
International Centre for Radio Astronomy Research, Curtin University, Kent Street, Bentley, WA, 6102, Australia
10
South African Astronomical Observatory, PO Box 9 Observatory, 7935, South Africa
11
Department of Astronomy, University of Cape Town, Private Bag X3, Rondebosch, 7701, South Africa
12
Department of Physics, University of the Free State, PO Box 339 Bloemfontein, 9300, South Africa
13
The Nevada Center for Astrophysics, University of Nevada, Las Vegas, 89154 NV, USA
14
Department of Physics and Astronomy, University of Nevada, Las Vegas, 89154 NV, USA
15
Centre for Extragalactic Astronomy, Department of Physics, Durham University, South Road, Durham, DH1 3LE, UK
16
Columbia Astrophysics Laboratory, Columbia University, New York, NY 10027, USA
17
College of Physics and Electronic Engineering, Qilu Normal University, 250200 Jinan, PR China
18
Yunnan Observatories, Chinese Academy of Sciences, Kunming 650216, PR China
19
Institute for Frontier in Astronomy and Astrophysics, Beijing Normal University, Beijing, 102206, PR China
⋆ Corresponding authors: This email address is being protected from spambots. You need JavaScript enabled to view it.
, This email address is being protected from spambots. You need JavaScript enabled to view it.
, This email address is being protected from spambots. You need JavaScript enabled to view it.
Received:
31
March
2025
Accepted:
4
July
2025
Abstract
The X-ray transient source EP240309a/EP J115415.8−501810 was first detected by the Wide-field X-ray Telescope on board the Einstein Probe (EP) instrument during the commissioning phase. Subsequent optical observations confirmed it as a cataclysmic variable of the intermediate polar type with a 238.2 s spinning white dwarf on a ∼3.76 h orbit. We report the source discovery and follow-up studies carried out with the EP’s Follow-up X-ray Telescope. A periodic variation of 231 s was detected in the 0.3−2 keV band, while no obvious pulsation appeared in the 2−10 keV band. The spectral analysis showed that the X-ray emission could be described by an absorbed bremsstrahlung model with kT > 11 keV. The partial covering absorption, with a hydrogen column density NH = 2.0 × 1022 cm−2 and covering fraction of around 0.9, is much higher than the interstellar absorption along the line of sight. According to the distance of d = 309.5 pc obtained from the Gaia parallax, we estimated that the luminosity of this source in the 0.3−10 keV range is ∼2 × 1032 erg s−1. In addition, a phase-resolved spectral analysis revealed that the detected periodic variation is mainly caused by the change in the absorption column density. In this scenario, the spin modulation arises due to absorption from the pre-shock accretion flow of the X-ray emitting pole, while the optical radiation is modulated at the orbital side band (ωspin − Ωorbit) due to the reprocessing in regions within the binary system. Due to this unusual transient behaviour for an intermediate polar, we also searched for radio signals similar to those observed in the new class of long period transients. We derived upper limits with ASKAP of 200–300 μJy beam−1 in the range 800–1500 MHz and with MWA of 40–90 mJy beam−1 in the range 80–300 MHz.
Key words: accretion, accretion disks / binaries : close / binaries: spectroscopic / novae, cataclysmic variables / white dwarfs / X-rays: binaries
© The Authors 2025
 Open Access article, published by EDP Sciences, under the terms of the Creative Commons Attribution License (https://creativecommons.org/licenses/by/4.0), which permits unrestricted use, distribution, and reproduction in any medium, provided the original work is properly cited.
This article is published in open access under the Subscribe to Open model. This email address is being protected from spambots. You need JavaScript enabled to view it. to support open access publication.
1. Introduction
White dwarfs (WDs) are the common endpoints in the evolution of solar-mass stars. They are often observed in binary systems known as cataclysmic variables (CVs), where they accrete material from a low-mass companion. Intermediate polars (IPs) are one kind of magnetic CV in which the WD accretes mass from a late-type main sequence star and spins faster than the orbital period (Patterson 1994; Mukai 2017). Depending on the WD magnetic field strength, the accreted matter might form accretion disks truncated at the magnetospheric radius, from which the material is funneled onto the polar caps along the magnetic field lines, releasing gravitational energy. A stand-off shock is formed at the pole(s) below which matter cools via optically thin thermal (∼10–40 keV) X-ray radiation, giving rise to pulsed emission at the rotational period of the WD. Modulations of the X-ray emission at the orbital period are rarely observed in relatively high-inclination systems (Parker et al. 2005; Bernardini et al. 2018).
The X-ray spectra of IPs are generally complex, consisting of heavily absorbed multi-temperature plasma and often also an optically thick component arising from the heated WD polar cap (Mukai 2017; de Martino et al. 2020). As of 2021, 71 IPs have been identified and more than 100 additional candidates are known1.
On March 9, 2024, a new transient triggered the Wide-field X-ray Telescope (WXT) on board the Einstein Probe (EP) instrument during its commissioning phase. It was initially called EP240309a (Ling et al. 2024). Subsequent observations with EP’s Follow-up X-ray Telescope (FXT), identified this new transient as a candidate CV in high state (Ling et al. 2024), subsequently naming it EP J115415.8−501810 (EP J1154−5018 hereafter). Follow-up studies, including observations from Transiting Exoplanet Survey Satellite (TESS) and telescopes at the South African Astronomical Observatory (SAAO), have revealed it to be an IP with a spin period of 3.97 min and an orbital period of 3.76 h (Buckley et al. 2024; Potter et al. 2024). Chang et al. (2024) also performed a radio observation at 1.28 GHz and no radio counterpart was found within the error circle of the EP X-ray position. In this work, we report on the EP discovery of EP J1154−5018 via detailed X-ray timing and spectral analyses. In Section 2 we present the data processing and data analysis results. In Section 3 we present the radio upper limits. We discuss our results and draw a brief conclusion in Section 4.
2. EP data analysis and results
The main scientific objective of the EP mission is to monitor and survey the sky in the soft X-ray band. The EP was launched on January 9, 2024, and soon entered the commissioning and calibration phase, and then formally started its scientific mission in July 2024. The scientific payloads of EP include WXT and FXT. WXT has lobster-eye micro-pore X-ray focusing optics, giving it an instantaneous larger field-of-view (3600 sq. deg.) compared to previous wide-field X-ray monitors. It operates in the 0.5−4 keV band and also has very high sensitivity ((2−3) × 10−11 erg cm−2 s−1 for 1 ks exposure). FXT consists of two co-aligned units, FXT-A and FXT-B. Each unit adopts a Wolter-I nested telescope and pn-CCDs as the focal plane detectors. FXT has a field-of-view of 1° ×1° and an angular resolution of 30′′. The telescope has a detection energy range 0.3−10 keV, with an effective area of 600 cm2 (2 units) at 1.25 keV and an energy resolution of 120 eV (FWHM; Yuan et al. 2022).
EP J1154−5018 was detected at the position of RA = 178.57°, Dec = − 50.29° (J2000, with an uncertainty of 2.1 arcmin; Ling et al. 2024). There were eight WXT observations covering the field of this source (see Table 1). The WXT data were reduced using the wxtpipeline tool from the WXT Data Analysis Software (WXTDAS). The calibration processes of the raw data include coordinate transformation, flagging hot and bad pixels, calculating the pulse-invariant values, screening events and extracting a sky image. We used the tools in WXTDAS to detect point-like sources and extracted light curves and spectra as well as the corresponding backgrounds, the ancillary response files, and the response matrices. The default region for source extraction is a circle with a radius of 9.1′, and the background region is an annulus with the inner and outer radii of 18.2′ and 36.4′, respectively.
List of the 2024 observations of EP J1154−5018 presented in this work.
The FXT conducted a 3093 s observation with the full-frame mode on March 16, 2024 (ObsID 08500000024). This mode provides full imaging capability with a time resolution of 50 ms, which could be used to search for periodicities in the sub-second regime. More accurate position of EP J1154−5018 has been obtained by FXT, RA = 178.566° and Dec = − 50.303° (J2000, with an uncertainty of about 10 arcsec; Ling et al. 2024). For this observation, we first used the fxtchain tool in the Follow-up X-ray Telescope Data Analysis Software (FXTDAS, version 1.10)2 package to reduce the FXT data. This task chain includes particle identification, calculating the pulse invariant values, flagging bad pixels and hot pixels, as well as screening of good time intervals. The source region was defined by a circle with a radius of 0.9′, while the background region was an annulus with inner and outer radii of 0.9′ and 2.9′, respectively. Then, the spectra and light curves were extracted with the given source and background regions, along with the corresponding ancillary files and redistribution matrices. In addition, we used the fxtbary tool to correct the photon arrival times to the Solar System barycenter using the JPL DE405 ephemeris.
The 0.3−10 keV light curve with a bin size of 20 s was extracted based on the combined events (FXT-A and FXT-B). At the same time, the hardness ratio (2 − 6 keV / 0.3 − 2 keV) in 120 s bins was calculated to search for possible spectral variations. The 0.5–4 keV light curve observed by WXT shows an increase of flux near the time of the FXT observation, as shown in Figure 1. During the FXT observation, the 0.3–10 keV light curve illustrates a decreasing trend with relatively strong variations in short time scales, but subsequent WXT observations show an increase in X-ray intensity (see Figure 1). At the same time, the hardness ratio shows a tendency to harden during the low-count-rate episodes. The FXT light curve can be fitted with a sine function at the known orbital period, indicating that the observed variations may be due to orbital motion. However, it cannot be verified due to limitations of the single exposure. On the other hand, the long-term WXT light curve shows an increase in intensity that suggests that the source is in a rise to a high state.
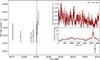 |
Fig. 1. Light curves of EP J1154−5018. Main panel: Average count rates (black dots) of each observation by EP/WXT. The red vertical line indicates the start time of the EP/FXT observation. Inset: Light curve (with 20 s bin size) and hardness ratio (with 120 s bin size) of EP/FXT observation. The details of the observations can be found in Table 1. |
For the FXT observation, we performed a periodic signal search in two energy bands, 0.3–2 keV and 2–10 keV, using the  test (Buccheri et al. 1983), with the results shown in Figure 2. We assumed that the pulse profile is a superposition of two sine waves (n = 2, taking a larger value of n leads to similar result). We calculated the phase for each photon arrival time and obtained the value of
  . The
. The  value peaks at the period of 231 s for the 0.3 − 2 keV data, while no significant periodicity is detected based on the 2 − 10 keV data, which means that pulse signal was only significantly detected in the soft energy range. The result is consistent with that obtained by Pearson χ2 test, but with higher significance. Assuming that the potential variability is instrumental white noise, we used the period distribution determined from 10 000 samples based on the observed distribution and estimate the 68% confidence error to be 2 s. Using the
  distribution of 10 000 samples from a uniform distribution, the significance of this periodicity is found to be ∼4σ.
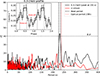 |
Fig. 2. Period search results and pulse profile of EP/FXT data. Main panel: Period-searching results using the |

Analysis of TESS data (Potter et al. 2024) reported an orbital frequency Ω (period = 3.7614(4) h). Assuming the spin frequency is ωx (period = 231 ± 2 s) as detected by FXT, then the periods corresponding to the positive (ωx + Ω) and negative beat (ωx − Ω) frequencies are 227 s and 235 s, respectively, which are marked in Figure 2. We also marked the spin period they reported, which is close to the (ωx − Ω) beat period of X-rays. The harmonic of the optical period of 119 s is not detected in the FXT data.
The pulse profile in the range 0.3 − 2 keV is folded with a period of 231 s with phase 0 corresponding to the midpoint of the observation (inset of Figure 2). The folded pulse profile exhibits a single peak per cycle (Figure 2), similar to that in the optical band. Without a spin ephemeris in the optical band, a direct phase comparison between the X-ray and optical pulse profiles is not possible. The pulse fraction in 0.3 − 2 keV is calculated to be 41 ± 9%, defined as (Cmax − Cmin)/(Cmax + Cmin), where Cmax and Cmin represent the maximum and minimum counts in the folded pulse profile. The pulse fraction of the 2–10 keV profile (folded with a period of 231 s) is only 20 ± 10 %. The spin modulation amplitude usually varies with energy for IPs in the X-ray band. Most of them have stronger modulation at lower energies due to the photoelectric absorption effects from the pre-shock material within the accretion curtain (Rosen et al. 1988; Hellier 1993; Mukai 2017; de Martino et al. 2020). The absence of periodic variations in the 2–10 keV band is consistent with this interpretation.
The FXT spectra were fitted using the XSPEC 12.14.0b software package (Arnaud 1996). The events in energy ranges 0.1−1.0 keV, 1.0−4.1 keV, 4.1−5.7 keV, and 5.7−11.9 keV were grouped into 15, 33, 7, and 4 bins using the tool grppha. We applied the model tbabs × tbpcf × bremss to fit the 0.3 − 10 keV spectrum generated from both the FXT-A and FXT-B data (left panel of Figure 3). The Tuebingen-Boulder model tbabs (Wilms et al. 2000) was used to account for the interstellar medium absorption along the line of sight. The parameter nH of tbabs was fixed at the Galactic value of 8.6 × 1020 cm−2 from HI4PI Collaboration 2016. The tbpcf model, which is typically used in the spectral fitting of IPs (Norton & Watson 1989; Mukai 2017), was included to account for the strong absorption below 2 keV. The inclusion of a partial covering absorber reduced the C-stat by 101 (with 26 d.o.f.), thus accounting for localised absorption of the X-ray emission by the pre-shock accretion flow (Done & Magdziarz 1998). We find that the local partial absorption has a hydrogen column density of 2.0 × 1022 cm−2 and a covering fraction of 88%. The X-ray radiation from post-shock region can be described by the bremsstrahlung process. Due to the limitation of the energy range of FXT, the fit yields a lower limit of 11 keV for the plasma temperature. We applied the optically thin emitting plasma model, apec, for comparison. We find that it was also unable to constrain the plasma temperature, and only reduced the C-stat by 0.18 (with 26 d.o.f.). To avoid over-interpreting the model, we still used the bremss model for fitting. Using the distance d = 309.5 ± 0.4 pc of the optical counterpart, Gaia DR3 5370642890382757888, derived by Bailer-Jones et al. (2021), the unabsorbed luminosity in the 0.3−10 keV energy range is ∼2.1 × 1032 erg s−1. The fitting results are listed in Table 2. Errors are quoted at the 90% confidence level for a single parameter of interest.
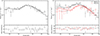 |
Fig. 3. Phase-average and phase-resolved spectral fitting of EP/FXT data. Left panel: Phase-average spectrum fitted with the model tbabs × tbpcf × bremss and the residuals of the fit. Right panel: Phase-resolved spectra. The “pulse-on” represents phase 0.2−0.6 and “pulse-off” phase 0.6−1.2 (see the inset in Figure 2). The best-fitting parameters are listed in Table 2. |
The phase-resolved spectra are extracted by collecting the source events into “pulse-on” and “pulse-off” parts using the Xselect tool (see the inset in Figure 2). The same model is applied to fit the pulse-on (phase 0.2 − 0.6) spectrum and the pulse-off (phase 0.6 − 1.2) spectrum (Figure 3, right panel). We fixed the plasma temperature of the bremsstrahlung model component at 12 keV due to the low statistic at higher energies. We checked that the constraints of other fitting parameters are robust against changes in the plasma temperature. The main spectral differences between the pulse-on and pulse-off intervals occur below 3 keV. In terms of fitting parameters, this is reflected in the variation of the column density of the partial covering absorption component (Table 2) as expected in IP systems. The normalisation of the Bremsstrahlung component displays no significant variation within error.
Spectral fitting parameters with C-statistic.
3. Radio upper limits
The Australian SKA Pathfinder (ASKAP; Hotan et al. 2021) is a 36-antenna interferometer equipped with phased-array feeds that widen its field-of-view to approximately 36 sq. deg, observing at a frequency range 800–1500 MHz. It is undertaking several large surveys, the calibrated visibilities of which are accessible shortly after observation3. EP J1154−5018 was within the field-of-view of observations from the Variables and Slow Transients (VAST; Murphy et al. 2013) survey and the Rapid ASKAP Continuum Survey (RACS; McConnell et al. 2020), which have integration times of 12 min and 15 min per observation, respectively. We searched for five epochs of RACS spaced between March 27, 2020, and January 11, 2024, and nine epochs of VAST spaced between June 23, 2023, and August 16, 2024. We examined images formed from the integration of each epoch (via WSCLEAN;Offringa et al. 2014), finding no counterparts down to RMS noise levels of 200–300 μJy beam−1. We also performed a time-domain search at a resolution of 10 s, by subtracting the continuum model and re-imaging every time step. We find no bursting transient or pulsed radio signals down to RMS noise levels of ∼2–3 mJy beam−1.
The Murchison Widefield Array (MWA; Tingay et al. 2013; Wayth et al. 2018) is a low-frequency (80–300 MHz), wide-field-of-view (500–1000 sq. deg.) radio interferometer comprising 128–256 tiles, co-located with ASKAP. Under project code G0080, the Galactic Plane Monitor has been repeatedly scanning the Southern Milky Way over |b|< 15° (with decreasing sensitivity from |b|> 10°) with integrations of 30–45 minutes at 185–215 MHz from 2022 to 2025 (see Methods of Hurley-Walker et al. 2023, ; to be described in full by Hurley-Walker et al. in prep). Eleven observations with sensitivity to EP J1154−5018 were taken from December 15, 2024, to January 6, 2025. No counterparts were found in continuum imaging at five-minute intervals down to a noise level of 40–90 mJy beam−1. A time-domain search following the same method as for the ASKAP data yielded no bursting transient or pulsed radio signals on a 4-s cadence to RMS noise levels of ∼350–800 mJy beam−1.
4. Discussion and conclusion
EP J1154−5018 is an X-ray transient source discovered by the EP mission. The optical follow-up observations (Potter et al. 2024) classified this source as an IP. Optical photometry and spectroscopy revealed a binary orbital period of 3.7614 h and a proposed WD spin period of 238 s, while the optical beat period of 243 s was also detected. Using the FXT observation, a periodic modulation at a period of 231 ± 2 s was detected in the energy range 0.3−2 keV, with a significance exceeding 4σ. However, no harmonics of the spin period were detected as shown in Figure 2. The broad envelope of the peak in the  periodogram precludes a clear determination of a beat period in the X-rays.
Our spin periodicity detection in the X-ray band deviates significantly from those reported in the optical band, and no periodic signal corresponding to 231 s was found in the Lomb–Scargle periodogram in Potter et al. 2024. However, the closeness of the longer optical period of 238 s to the possible negative beat period (ωx − Ω) of 235 s in X-rays, considering the relatively large uncertainty of the X-ray periodicity estimated at 2 s at the 68% level, may help reconcile the optical and X-ray results. If the peak at 362.5 c/d observed in the optical band corresponds to the beat frequency, using the orbital frequency derived from TESS of 6.3806 c/d, then the spin frequency is 368.9 c/d. This corresponds to a spin period of 234 s, which is within 2σ of the inferred X-ray period. The additional peak observed in the optical periodogram and interpreted as the beat frequency would instead correspond to (ω − 2Ω) at 356.12 c/d or 242.6 s. The variations in the relative dominance of the spin and beat frequencies between the X-ray and optical bands are not unusual in the case of IPs (see, e.g., Bernardini et al. 2012). This can be explained by the fact that the optical emission is affected by X-ray reprocessing at different locations within the binary system.
Our spectral analysis reveals that the X-ray emission from this source is thermal and well modelled by a Bremsstrahlung model whose temperature (> 11 keV) cannot be constrained with the present data and affected by a strong partial (∼90%) covering absorption below 2 keV. The local hydrogen absorption column density reaches 2.0 × 1022 cm−2, significantly exceeding the interstellar value of 8.6 × 1020 cm−2 that has been estimated on the basis of HI4PI Collaboration 2016. The phase-resolved spectral analysis shows that the periodic variation detected in the energy range 0.3−2 keV is mainly caused by the change in the absorption column density. This may indicate that the cool pre-shock accretion flow absorbs the X-ray emission at different angles as the WD rotates.
The EP/WXT long-term coverage reveals that EP J1154−5018 is undergoing luminosity changes of at least a factor of three over about a month-long time span. This is also confirmed by the long term optical photometric coverage reported by Potter et al. (2024). Overall, IPs rarely undergo frequent luminosity state changes (e.g., Kennedy et al. 2017; Littlefield et al. 2025), indicating unusual behaviour for this newly discovered magnetic system.
In the past few years, a new class of objects emitting bright periodic radio bursts have been discovered, known as long-period transients (LPTs). Eight such sources have been discovered thus far; however, the recent discovery of two LPTs in M dwarf-WD binary systems (ILT J1101+5521 and GLEAM-X J0704–37) suggests that WD binaries, especially those with short orbital periods, might be the progenitors of some LPTs. In that view, we searched in the radio archive for EP J1154−5018, but we were only able to derive an upper limit. Therefore, despite its unusual behaviour, EP J1154−5018 does not appear to belong to this new class of systems.
The detection of transient X-ray emission from EP J1154−5018 with EP, along with subsequent X-ray follow-up and coordinated optical observations, has enabled us to classify this system as an IP. This demonstrates the potential of the EP mission to discover previously unknown CV systems that re-emerge from deep low states or undergo outbursts. This is particularly significant in the case of IPs, whose changes in state are extremely rare.
Via the CSIRO Astronomy Science Data Access portal: https://data.csiro.au/domain/casdaObservation/
Acknowledgments
This work is based on data obtained with Einstein Probe, a space mission supported by Strategic Priority Program on Space Science of Chinese Academy of Sciences, in collaboration with ESA, MPE and CNES (Grant No. XDA15310000), the Strategic Priority Research Program of the Chinese Academy of Sciences (Grant No. XDB0550200), and the National Key R&D Program of China (2022YFF0711500). We acknowledge the support by the National Natural Science Foundation of China (Grant Nos. 12321003, 12103065, 12333004, 12373040, 12021003, 12473016, 12373051, 12273029, 12221003), the China Manned Space Project (Grant Nos. CMS-CSST-2021-A13, CMS-CSST-2021-B11), and the Youth Innovation Promotion Association of the Chinese Academy of Sciences. We acknowledge the data resources and technical support provided by the China National Astronomical Data Center, the Astronomical Science Data Center of the Chinese Academy of Sciences, and the Chinese Virtual Observatory. This scientific work uses data obtained from Inyarrimanha Ilgari Bundara, the CSIRO Murchison Radio-astronomy Observatory. Support for the operation of the MWA is provided by the Australian Government (NCRIS), under a contract to Curtin University administered by Astronomy Australia Limited. The Australian SKA Pathfinder is part of the Australia Telescope National Facility which is managed by CSIRO. Operation of ASKAP is funded by the Australian Government with support from the National Collaborative Research Infrastructure Strategy. ASKAP and the MWA use the resources of the Pawsey Supercomputing Centre. Establishment of ASKAP, Inyarrimanha Ilgari Bundara, and the Pawsey Supercomputing Centre are initiatives of the Australian Government, with support from the Government of Western Australia and the Science and Industry Endowment Fund. We acknowledge the Wajarri Yamaji People as the Traditional Owners and Native Title Holders of the observatory site. N.R. is supported by the European Research Council (ERC) via the Consolidator Grant “MAGNESIA” (No. 817661) and the Proof of Concept “DeepSpacePulse” (No. 101189496), by the Catalan grant SGR2021-01269, the Spanish grant ID2023-153099NA-I00, and by the program Unidad de Excelencia Maria de Maeztu CEX2020-001058-M. DdM acknowledges financial support from INAF Research Grants AstroFund 2022 and 2024. FCZ is supported by a Ramón y Cajal fellowship (grant agreement RYC2021-030888-I). NHW is supported by an Australian Research Council Future Fellowship (project number FT190100231) funded by the Australian Government. Support for KM is provided by NASA ADAP program (NNH22ZDA001N-ADAP) grant.
References
- Arnaud, K. A. 1996, ASP Conf. Ser., 101, 17 [Google Scholar]
- Bailer-Jones, C. A. L., Rybizki, J., Fouesneau, M., Demleitner, M., & Andrae, R. 2021, AJ, 161, 147 [Google Scholar]
- Bernardini, F., de Martino, D., Falanga, M., et al. 2012, A&A, 542, A22 [NASA ADS] [CrossRef] [EDP Sciences] [Google Scholar]
- Bernardini, F., de Martino, D., Mukai, K., & Falanga, M. 2018, MNRAS, 478, 1185 [Google Scholar]
- Buccheri, R., Bennett, K., Bignami, G. F., et al. 1983, A&A, 128, 245 [NASA ADS] [Google Scholar]
- Buckley, D. A. H., Monageng, I., Aydi, E., Scaringi, S., & Charles, P. A. 2024, ATel., 16554, 1 [Google Scholar]
- Chang, N., Jiang, P., Liao, J., et al. 2024, ATel., 16572, 1 [Google Scholar]
- de Martino, D., Bernardini, F., Mukai, K., Falanga, M., & Masetti, N. 2020, Adv. Space Res., 66, 1209 [Google Scholar]
- Done, C., & Magdziarz, P. 1998, MNRAS, 298, 737 [NASA ADS] [CrossRef] [Google Scholar]
- Hellier, C. 1993, MNRAS, 265, L35 [Google Scholar]
- HI4PI Collaboration (Ben Bekhti, N., et al.) 2016, A&A, 594, A116 [NASA ADS] [CrossRef] [EDP Sciences] [Google Scholar]
- Hotan, A. W., Bunton, J. D., Chippendale, A. P., et al. 2021, PASA, 38, e009 [NASA ADS] [CrossRef] [Google Scholar]
- Hurley-Walker, N., Rea, N., McSweeney, S. J., et al. 2023, Nature, 619, 487 [NASA ADS] [CrossRef] [Google Scholar]
- Kennedy, M. R., Garnavich, P. M., Littlefield, C., et al. 2017, MNRAS, 469, 956 [Google Scholar]
- Ling, Z. X., Liu, M. J., Liu, Y., et al. 2024, ATel., 16546, 1 [Google Scholar]
- Littlefield, C., Bonnardeau, M., & Garnavich, P. 2025, ATel., 17050, 1 [Google Scholar]
- McConnell, D., Hale, C. L., Lenc, E., et al. 2020, PASA, 37, e048 [Google Scholar]
- Mukai, K. 2017, PASP, 129, 062001 [Google Scholar]
- Murphy, T., Chatterjee, S., Kaplan, D. L., et al. 2013, PASA, 30, e006 [NASA ADS] [CrossRef] [Google Scholar]
- Norton, A. J., & Watson, M. G. 1989, MNRAS, 237, 853 [Google Scholar]
- Offringa, A. R., McKinley, B., Hurley-Walker, N., et al. 2014, MNRAS, 444, 606 [Google Scholar]
- Parker, T. L., Norton, A. J., & Mukai, K. 2005, A&A, 439, 213 [NASA ADS] [CrossRef] [EDP Sciences] [Google Scholar]
- Patterson, J. 1994, PASP, 106, 209 [Google Scholar]
- Potter, S. B., Buckley, D. A. H., Scaringi, S., et al. 2024, MNRAS, 532, L21 [Google Scholar]
- Rosen, S. R., Mason, K. O., & Cordova, F. A. 1988, MNRAS, 231, 549 [NASA ADS] [CrossRef] [Google Scholar]
- Tingay, S. J., Goeke, R., Bowman, J. D., et al. 2013, PASA, 30, 7 [Google Scholar]
- Wayth, R. B., Tingay, S. J., Trott, C. M., et al. 2018, PASA, 35, 33 [Google Scholar]
- Wilms, J., Allen, A., & McCray, R. 2000, ApJ, 542, 914 [Google Scholar]
- Yuan, W., Zhang, C., Chen, Y., & Ling, Z. 2022, in Handbook of X-ray and Gamma-ray Astrophysics, eds. C. Bambi, & A. Sangangelo, 86 [Google Scholar]
All Tables
All Figures
|
Fig. 1. Light curves of EP J1154−5018. Main panel: Average count rates (black dots) of each observation by EP/WXT. The red vertical line indicates the start time of the EP/FXT observation. Inset: Light curve (with 20 s bin size) and hardness ratio (with 120 s bin size) of EP/FXT observation. The details of the observations can be found in Table 1. |
| In the text | |
|
Fig. 2. Period search results and pulse profile of EP/FXT data. Main panel: Period-searching results using the |
| In the text | |
|
Fig. 3. Phase-average and phase-resolved spectral fitting of EP/FXT data. Left panel: Phase-average spectrum fitted with the model tbabs × tbpcf × bremss and the residuals of the fit. Right panel: Phase-resolved spectra. The “pulse-on” represents phase 0.2−0.6 and “pulse-off” phase 0.6−1.2 (see the inset in Figure 2). The best-fitting parameters are listed in Table 2. |
| In the text | |
Current usage metrics show cumulative count of Article Views (full-text article views including HTML views, PDF and ePub downloads, according to the available data) and Abstracts Views on Vision4Press platform.
Data correspond to usage on the plateform after 2015. The current usage metrics is available 48-96 hours after online publication and is updated daily on week days.
Initial download of the metrics may take a while.