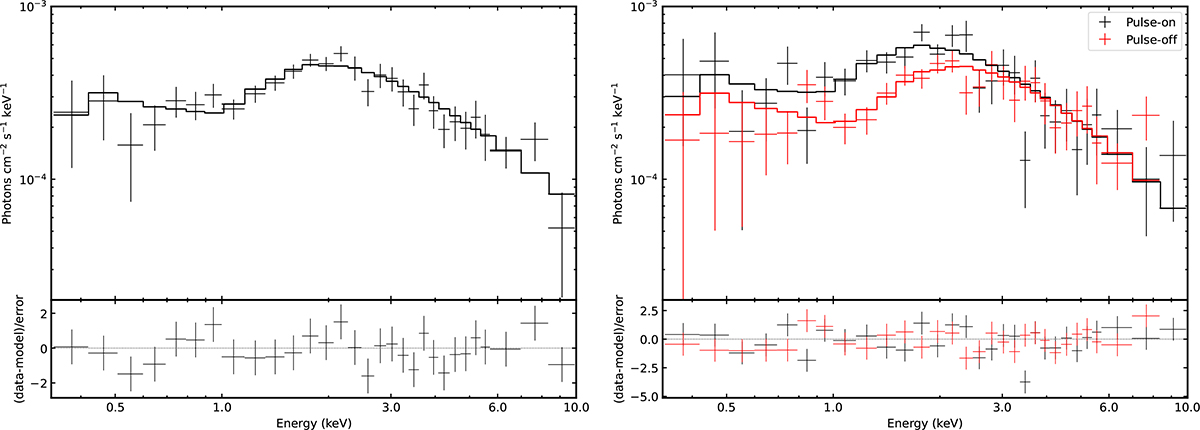
Fig. 3.
Download original image
Phase-average and phase-resolved spectral fitting of EP/FXT data. Left panel: Phase-average spectrum fitted with the model tbabs × tbpcf × bremss and the residuals of the fit. Right panel: Phase-resolved spectra. The “pulse-on” represents phase 0.2−0.6 and “pulse-off” phase 0.6−1.2 (see the inset in Figure 2). The best-fitting parameters are listed in Table 2.
Current usage metrics show cumulative count of Article Views (full-text article views including HTML views, PDF and ePub downloads, according to the available data) and Abstracts Views on Vision4Press platform.
Data correspond to usage on the plateform after 2015. The current usage metrics is available 48-96 hours after online publication and is updated daily on week days.
Initial download of the metrics may take a while.