Open Access
Fig. 10
Download original image
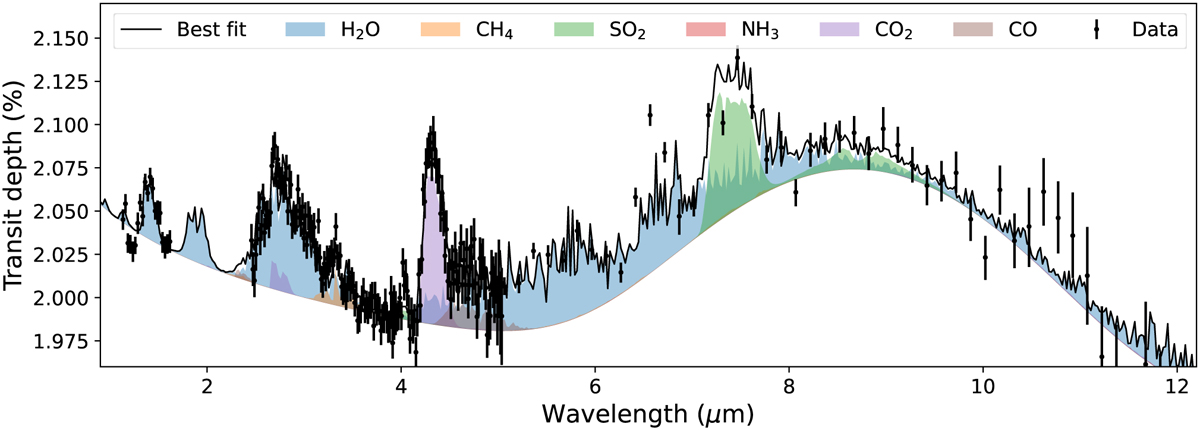
Best-fit spectrum for Case 10. The data plotted in the bottom panel consists of HST WFC3 (Kreidberg et al. 2018), JWST NIRCam (Welbanks et al. 2024), and JWST MIRI/LRS (Dyrek et al. 2024).
Current usage metrics show cumulative count of Article Views (full-text article views including HTML views, PDF and ePub downloads, according to the available data) and Abstracts Views on Vision4Press platform.
Data correspond to usage on the plateform after 2015. The current usage metrics is available 48-96 hours after online publication and is updated daily on week days.
Initial download of the metrics may take a while.