Fig. 2.
Download original image
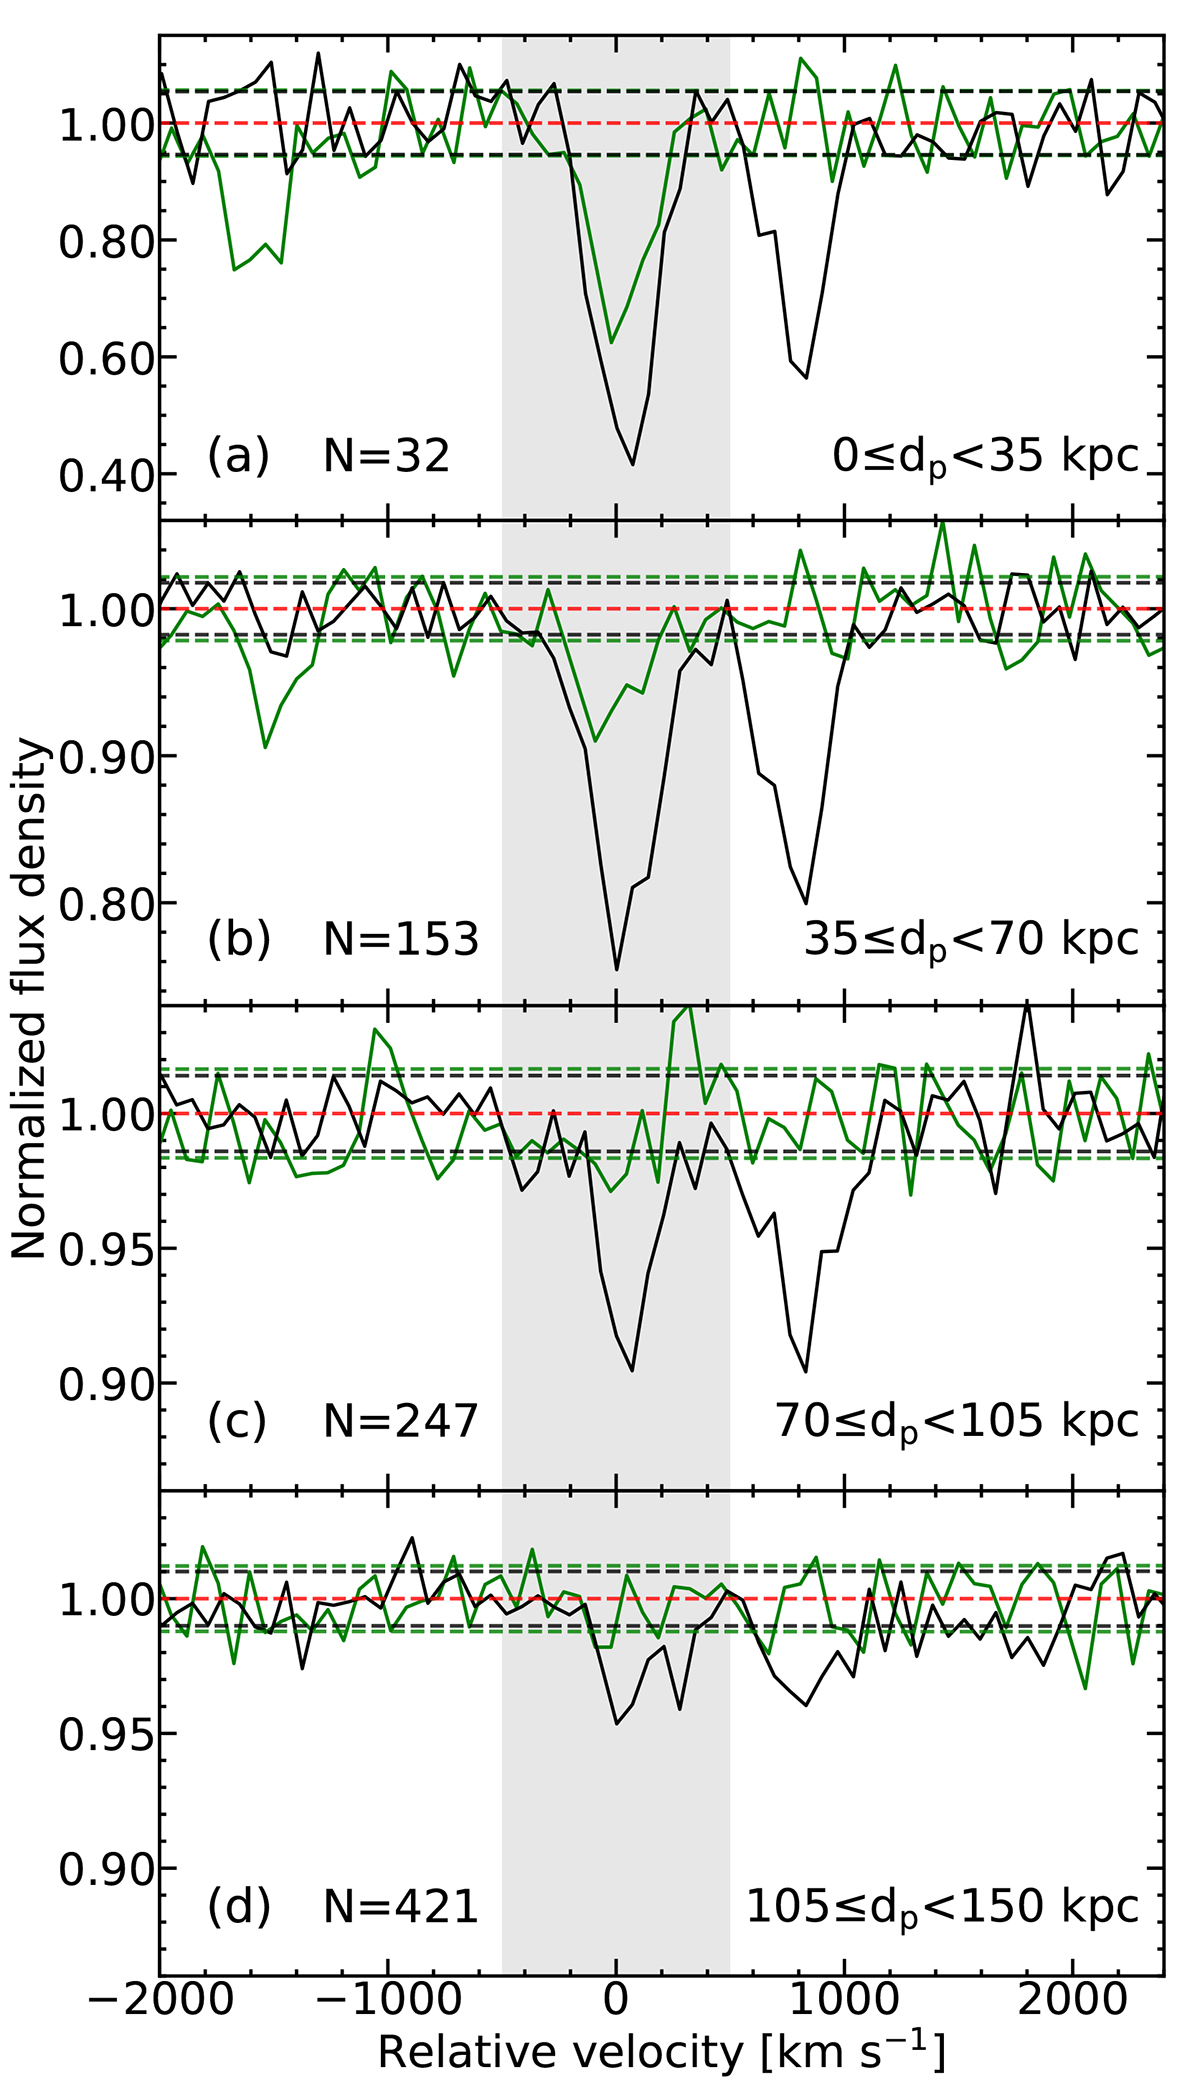
Demonstration of the median composite spectra of background quasars in different dp bins as shown in each of panel. The black and green lines represent the Mg IIλ2796 and Fe IIλ2600 absorption line profiles, respectively. The black and green dashed lines represent the standard deviation of the normalized flux density for Mg IIλ2796 and Fe IIλ2600, respectively. The gray shaded regions mark the spectral region used for measuring the equivalent widths of the Mg IIλ2796 or Fe IIλ2600 absorption lines.
Current usage metrics show cumulative count of Article Views (full-text article views including HTML views, PDF and ePub downloads, according to the available data) and Abstracts Views on Vision4Press platform.
Data correspond to usage on the plateform after 2015. The current usage metrics is available 48-96 hours after online publication and is updated daily on week days.
Initial download of the metrics may take a while.