| Issue |
A&A
Volume 701, September 2025
|
|
|---|---|---|
| Article Number | A1 | |
| Number of page(s) | 7 | |
| Section | Extragalactic astronomy | |
| DOI | https://doi.org/10.1051/0004-6361/202554887 | |
| Published online | 26 August 2025 | |
Radial dependence of the ratio of Fe II to Mg II equivalent widths in emission-line galaxies
1
Guangxi Key Laboratory for Relativistic Astrophysics, School of Physical Science and Technology, Guangxi University, Nanning 530004, PR China
2
School of Physics and Electronic Information, Guangxi Minzu University, Nanning 530006, PR China
⋆ Corresponding author: This email address is being protected from spambots. You need JavaScript enabled to view it.
Received:
31
March
2025
Accepted:
5
July
2025
Abstract
Context. The circumgalactic medium (CGM) plays a key role in galaxy evolution by regulating gas accretion, feedback, and metal enrichment, with its chemical evolution and metal distribution revealed through quasar absorption line studies.
Aims. Using data from Sloan Digital Sky Survey extended Baryon Oscillation Spectroscopic Survey (SDSS/eBOSS), we constructed a dataset comprising 853 quasar-emission-line-galaxy (quasar-ELG) pairs with an impact parameter (dp) within 150 kpc. We then analyzed the variations in the ratio of the equivalent widths of the Fe II absorption line to the Mg II absorption line as a function of the impact parameter.
Methods. To achieve this aim, we employed a spectral stacking method to generate median composite spectra in the rest frame of the foreground ELGs. Subsequently, we measured the equivalent widths of the Fe IIλ2600 (Wrλ2600) and Mg IIλ2796 (Wrλ2796) absorption lines in these composite spectra.
Results. Our results indicate that the equivalent width ratio of R (≡Wrλ2600/Wrλ2796) varies as R ∝ (−0.64−0.06+0.08) log(dp [kpc]). Finally, we explored the potential causes and implications of this radial dependence.
Key words: galaxies: general / galaxies: halos / quasars: absorption lines
© The Authors 2025
 Open Access article, published by EDP Sciences, under the terms of the Creative Commons Attribution License (https://creativecommons.org/licenses/by/4.0), which permits unrestricted use, distribution, and reproduction in any medium, provided the original work is properly cited.
This article is published in open access under the Subscribe to Open model. This email address is being protected from spambots. You need JavaScript enabled to view it. to support open access publication.
1. Introduction
The circumgalactic medium (CGM) plays a fundamental role in the evolution of galaxies by regulating key processes such as gas accretion, feedback mechanism, and metal redistribution (e.g., Schiminovich et al. 2010; Whitaker et al. 2012; Peeples et al. 2014; Faucher-Giguère & Oh 2023). The CGM is a multiphase gas reservoir that extends from galaxy disks to their virial radii, offering critical insights into the interactions between galaxies and their environments (e.g., Lanzetta et al. 1995; Churchill et al. 2005; Prochaska et al. 2013; Johnson et al. 2015; Tumlinson et al. 2017; Chen & Zahedy 2024). As an interface between galaxies and the intergalactic medium (IGM), the CGM retains signatures of both pristine gas infall from the cosmic web and metal-enriched outflows driven by stellar winds, supernovae (SNe), and active galactic nucleus (AGN) feedback processes (e.g., Begelman et al. 1991; Kim & Ostriker 2015; Nelson et al. 2019; Veilleux et al. 2020; Donahue & Voit 2022). Although direct imaging of this diffuse gas remains challenging, the background quasar absorption spectra provide a powerful tool to probe the chemical and kinematic properties of the CGM (e.g., Bergeron 1986; Bowen et al. 2006; Hennawi et al. 2006; Chen et al. 2010, 2023, 2025; Bordoloi et al. 2011; Huang et al. 2016, 2021; Lan & Mo 2018; Wu et al. 2024).
In particular, the ratio of Fe II to Mg II absorption lines offers valuable insights into nucleosynthetic histories. Magnesium and iron originate from distinct stellar processes: magnesium is produced in core-collapse supernovae (CCSN), while iron is primarily synthesized in delayed Type Ia supernovae (SNe Ia; e.g., Timmes et al. 1995; Nomoto et al. 1997; Thielemann et al. 2003; Kobayashi et al. 2006, 2020). Outflows and winds transport these heavy elements from galactic disks into galaxy halos, thereby enriching the CGM (e.g., Chevalier & Clegg 1985; Oppenheimer & Davé 2006; Dalla Vecchia & Schaye 2008; Ceverino & Klypin 2009; Shimizu et al. 2019; Tortora et al. 2022; Villar Martín et al. 2024). Observational constraints on CGM metal abundances and gas kinematics, derived from background quasar absorption spectra, offer a crucial test of wind-driven enrichment scenarios, revealing the coupling between feedback mechanisms and chemical evolution across galactic halos.
In this study, we focus on the radial distribution of circumgalactic gas around emission-line galaxies (ELGs), a key population of star-forming galaxies at redshifts z ∼ 1, which bridges the gap between local star-forming systems and high-redshift galaxies. Using a sample of 853 quasar-galaxy pairs from the Sloan Digital Sky Survey extended Baryon Oscillation Spectroscopic Survey survey (SDSS/eBOSS; York et al. 2000), we investigate the absorption features of Mg II and Fe II absorption lines in ELGs. These absorption lines are imprinted on the spectra of the background quasar and are associated with the foreground ELGs. Our objective is to gain a deeper understanding of the spatial distribution of the metal-enriched gas, specifically Mg II and Fe II, surrounding the ELGs. This investigation may provide valuable insights into the relationship between star formation activity and metal enrichment processes within galaxies.
We provide our sample selection in Section 2 and an analysis in Section 3. Our results are presented and discussed in Section 4 and our conclusions are given in Section 5. Throughout this work, we assume a flat ΛCDM cosmology with Ωm = 0.3, ΩΛ = 0.7, and H0 = 70 km s−1 Mpc−1.
2. Sample selection
A set of quasar spectra in the wavelength range of 3800 Å to 9200 Å taken during SDSS-I/II (2000−2008; Abazajian et al. 2009) were released by SDSS (York et al. 2000). This range was then extended to 3600 Å to 10 500 Å thanks to SDSS-III/IV (2008−2020; Ahn et al. 2012; Smee et al. 2013; Dawson et al. 2013), with λ/Δλ ∼ 2000 resolution. In addition, the extended Baryon Oscillation Spectroscopic Survey (eBOSS; Dawson et al. 2016; Blanton et al. 2017) of SDSS aims to better understand dark matter, dark energy, the properties of neutrinos, and inflation. This survey provides a large dataset of ELGs1. ELGs fill a critical redshift gap in large-scale structure surveys, enabling precision cosmology at z ∼ 1 while probing galaxy evolution. The high spectral resolution and sensitivity of the ELG sample facilitate the analysis of key emission lines, such as [O II], Hβ, [O III], and Hα (Comparat et al. 2016), providing a reliable redshift measurement, with an accuracy better than 300 km s−1 (Raichoor et al. 2016, 2017). Utilizing the 750 414 quasars from the Sixteenth Data Release (DR16Q; Lyke et al. 2020) and 269 178 ELGs in eBOSS, we constructed a sample of quasar-ELG pairs with the aim to investigate the characteristics of Fe II and Mg II absorption lines around foreground ELGs, based on the following criteria:
-
The quasar-galaxy pairs are restricted to those satisfying 2800(zELG + 1) ≥ 1300(zQSO + 1) to avoid contamination from Lyα forest absorptions. Here, zELG and zQSO denote the redshifts of the foreground ELGs and background quasars, respectively. Additionally, the difference between zQSO and zELG must exceed 6000 km s−1 to minimize contamination caused by outflows from the background quasar.
-
The spectra of background quasars must exhibit a median signal-to-noise ratio (S/N) greater than 2 within the spectral regions spanning ±6000 km s−1 around the redshifts of the foreground galaxies, while covering a rest-frame wavelength range from 2550 Å to 2850 Å.
-
Each ELG spectrum must include at least one distinctly visible emission line (such as [O II] λ3729, Hβλ4862, [O III] λ5007, or Hαλ6564) that is substantially stronger than the surrounding random noise, as confirmed by visual inspection, to ensure the accuracy of the redshift measurement (Figure A.1 shows the stacked spectra of the ELGs).
-
The quasar spectra are excluded if they display abrupt features within ±3000 km s−1 of the foreground galaxy’s redshift, as identified through visual inspection, to ensure reliable superposition outcomes. Such features encompass prominent emission peaks, sky emission lines, and unrelated broad C IV absorption lines.
Finally, we obtained a sample of 853 quasar-ELG pairs with projected proper distances (dp) less than 150 kpc. Figure 1 illustrates the redshift distribution of the quasar-ELG pairs, where the average redshift for ELGs is 0.81 with a standard error of 0.12.
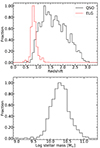 |
Fig. 1. Redshift distribution of quasar-ELG pairs (top) and the stellar mass distribution of the ELGs (bottom) in our sample. The ELG redshifts exhibit a median value of 0.82 with a standard error of 0.12, while the media stellar mass of the ELGs is 10.29 M⊙ with a standard error of 0.27 M⊙. |
3. Composite spectra and absorption line measurements
To address the typically weak absorption lines exhibited by ELGs, we employed a spectral stacking approach to enhance the S/N. The method involves grouping and stacking the background quasar spectra to generate composite spectra for subsequent absorption line measurements, as detailed in Sections 3.1 and 3.2.
3.1. Composite spectra
Using the dp bin size of 35 kpc, we divided the background quasar spectra are into four sub-groups: [0, 35) kpc, [35, 70) kpc, [70, 105) kpc, and [105, 150) kpc. To avoid the influence of outliers, a median estimator was used to obtain composite spectra for each bin, yielding a higher S/N compared to individual observations. The steps for generating the composite spectra are as follows: (1) The quasar spectra are shifted to the rest frame of the foreground ELGs by zELG; (2) The raw spectral flux of background quasars is re-normalized to the position of 3000 Å; (3) To obtain the composite spectrum of each given dp bin, we adopted the median stacking approach, which has also been utilized in previous studies (e.g., Zhu & Ménard 2013a; Bordoloi et al. 2011; Lan & Mo 2018; Chen et al. 2023). Since each spectrum covers both the 2550−2650 Å and 2750−2850 Å ranges in the rest wavelength, we used the fluxes on both sides of the absorption (2550−2594 and 2606−2650 Å for Fe IIλ2600 line, excluding the Fe IIλ2850 region in 2582−2590 Å; 2750−2790 and 2809−2850 Å for Mg IIλ2796) to compute the standard deviations and estimate the flux uncertainty for each data point.
3.2. Absorption line measurements
We first fit the pseudo-continuous spectrum of the quasar background spectrum with cubic spline curves and then measured the absorption lines. Gaussian functions were not used in the fitting of pseudo-continuum because spectra with significant emission line profiles have been excluded in Section 3.1. Figure 2 shows the median composite spectrum after normalization of the pseudo-continuum. We integrated the spectral data in ±500 km s−1 around the centers of the absorption line Fe IIλ2600 or Mg IIλ2796 to obtain the equivalent widths of the absorption line. Since there is no flux uncertainty in the median composite spectrum, we used the fluxes on both sides of the absorption line to compute the standard deviations to estimate the flux uncertainty for each data point. The uncertainty of the equivalent width of the absorption line is estimated based on the error transfer formula using flux uncertainty. All the measurements are listed in Table 1. We also performed a 1000-iteration bootstrap resampling to assess the uncertainty of equivalent width. The uncertainties estimated via the bootstrap method are marginally larger than those obtained through the method previously mentioned. The bootstrap uncertainties for  and
and  across bins from a to d are 0.216, 0.068, 0.036, 0.023 and 0.277, 0.099, 0.050, 0.035, respectively.
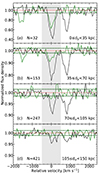 |
Fig. 2. Demonstration of the median composite spectra of background quasars in different dp bins as shown in each of panel. The black and green lines represent the Mg IIλ2796 and Fe IIλ2600 absorption line profiles, respectively. The black and green dashed lines represent the standard deviation of the normalized flux density for Mg IIλ2796 and Fe IIλ2600, respectively. The gray shaded regions mark the spectral region used for measuring the equivalent widths of the Mg IIλ2796 or Fe IIλ2600 absorption lines. |
4. Result and discussion
Figure 3a illustrates the median rest-frame equivalent widths of Fe IIλ2600 and Mg IIλ2796 absorption lines around ELGs as a function of the impact parameter (dp). It shows a significant decrease in the equivalent widths with increasing dp. This trend aligns with previous studies on the distribution of cool gas in galaxy halos (e.g., Bordoloi et al. 2011; Werk et al. 2013; Prochaska et al. 2014; Farina et al. 2014; Landoni et al. 2016; Lan & Mo 2018; Chen et al. 2023, 2025), which suggests a transition in the dominant physical processes regulating the CGM at different impact parameters. The observed decline in the equivalent widths as dp increases may be attributed to a combination of factors, including a reduction in metal column density, ionization effects, and gas kinematics (Werk et al. 2014; Tumlinson et al. 2017). We followed previous studies (e.g., Dey et al. 2015; Joshi et al. 2018) and measured the equivalent width ratio, which is defined as  , where
  and
and  represent the median rest-frame equivalent widths of Fe IIλ2600 and Mg IIλ2796 absorption lines, respectively. The uncertainty of R is calculated by the error transfer formula. The derived values of R are also depicted in Figure 3b and listed in Table 1.
Measurements from composite spectra.
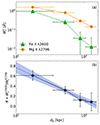 |
Fig. 3. Rest-frame equivalent widths of Fe IIλ2600 and Mg IIλ2796 (panel a), as well as their equivalent width ratio (panel b), as functions of impact parameter dp for ELGs. In panel b, the red-solid line represents the best-fit relation: |
Figure 3b illustrates a trend in which the R decreases significantly with increasing dp. To quantify this relationship, we employed a Bayesian linear regression developed by Kelly (2007) to perform the linear fit and thus obtained ![Mathematical equation: $ R = 1.41^{+0.11}_{-0.13}{-}0.64^{+0.08}_{-0.06} \log(d_{\mathrm{p}}\,[\mathrm{kpc}]) $](/articles/aa/full_html/2025/09/aa54887-25/aa54887-25-eq16.gif) . The slope coefficient indicates that for every tenfold increase in dp (i.e., one order of magnitude), R decreases by 0.64. In addition, we also tested a range of binning approaches with different dp bin-sizes and we observed consistent trends within the appropriate errors.
. The slope coefficient indicates that for every tenfold increase in dp (i.e., one order of magnitude), R decreases by 0.64. In addition, we also tested a range of binning approaches with different dp bin-sizes and we observed consistent trends within the appropriate errors.
High-resolution studies have shown that Mg II absorption lines often consist of multiple kinematic components (typically 2−10), with the number of components increasing with WMgII (Churchill et al. 2003). These studies have also indicated that Mg II and Fe II lines share similar Doppler parameters and column densities, while the column density ratio N(Fe II)/N(Mg II) exhibits little dependence on velocity or kinematic structure (Churchill et al. 2003; Dey et al. 2015; Zahedy et al. 2017).
Following this vein, if the observed equivalent width ratio is assumed to primarily reflect an intrinsic Fe/Mg abundance variation in the CGM gas – even though the column density measurements might be more or less biased by the dust depletion and ionization fraction (see discussions in Jenkins 2009; Dey et al. 2015), then we ought to consider what factors could be responsible for the variation. Using a sample of absorption lines from the SDSS metal absorption line catalog (Zhu & Ménard 2013b), Dey et al. (2015) found that R decreases slightly with increasing redshift, z, following the relationship R ∝ ( − 0.045 ± 0.005)z. Applying the scaling relationship to our ELG sample would result in ΔR = 0.0054 if their redshifts vary within the standard error of 0.12. This suggests that the redshift distribution of our ELG sample plays less of a role in producing the radial dependence of R as shown in Figure 3b.
To verify whether the properties of ELGs in our sample (stellar mass and star formation rate) would play a role in the variation of R with dp, we derived their star formation rates (SFRs) by utilizing the [O II] λ3729 luminosities of ELGs and employing the conversion model established by Kennicutt (1998). Then the stellar masses of our ELGs sample are retrieved directly from the ELG catalog (Raichoor et al. 2017). Figure 4 demonstrates the probability density distributions of the stellar mass and the SFR in each dp bin. To quantify the potential difference between the stellar mass distributions or the SFR distributions, we conducted a Kolmogorov-Smirnov (KS) test on each pair of distributions between different dp bins. The resulting p values (the null hypothesis probability of being drawn from the same parent distribution) are presented in Figure 4 and are seen to be consistently high across all cases. These results indicate that there are no statistically significant differences between either the stellar mass distributions or the SFR distributions among different dp bins (all p values are greater than 0.48). Therefore, the variation of R with dp in Figure 3b is less likely to be caused by the differences in stellar mass or star formation activity across different dp bins.
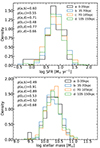 |
Fig. 4. Probability density distribution of star formation rate (top panel) and stellar mass (bottom panel) for ELG samples in each bin. |
The Mg/Fe abundance ratio at different radial distances may be regulated by a range of mechanisms. These include the interaction between outflows from central and satellite galaxies, inflows, the presence of an ambient CGM, and the mixing of materials from these sources. Cosmological zoom simulations (Zahedy et al. 2017; Hafen et al. 2019) have also revealed that the CGM is a complex mixture of diffuse intergalactic medium (IGM) accretion, along with CGM and interstellar medium (ISM) stripped from infalling satellites and winds from central and satellite galaxies, with the overall metallicity of the CGM decreasing as the radial distance increases.
The CGM around ELGs is known to be produced and enriched by outflows driven by star formation activity in these galaxies. Direct evidence for such outflows is observed in the blueshifted absorption lines present in galaxy spectra (e.g., Rubin et al. 2010; Bordoloi et al. 2014; Zhu et al. 2015; Chisholm et al. 2016). In addition, ELGs with higher SFRs tend to cause more powerful outflows of galactic cold gas, typically extending over scales of approximately 50−100 kpc (e.g., Bordoloi et al. 2011).
There is a fundamental difference in the formation channels of Fe and Mg; namely, after a delay of about 1 Gyr, SNe Ia originating from the thermonuclear detonation of carbon-oxygen white dwarfs in binary systems (Nomoto et al. 1984) become the dominant source of iron-peak elements (Matteucci & Greggio 1986; Maoz et al. 2012). In contrast, Mg, an α- element, is synthesized primarily in the CCSN of short-lived massive stars on a timescale of ≤50 Myr (e.g., Woosley & Weaver 1995). In this physical picture, iron enrichment is expected to occur after that of the α elements. The observed R radial gradient (i.e., Fe/Mg reduction with impact parameters) could indicate that the interior of the CGM is rich in material that has been processed by long-term galactic chemical evolution (dominated by Ia supernovae), while the exterior of the CGM retains components formed by early CCSN-driven outflows.
By studying the gas absorption features of cool gas around three lensing galaxies at z = 0.4−0.7, Zahedy et al. (2016) found that the Fe-rich gas in the inner regions (projected distances d = 3−15 kpc) of the massive lensed galaxies with uniform supersolar (Fe/Mg) ratios originate from SNe-Ia. They later speculated that if the ISM gas of massive galaxies is locally enriched by SNe-Ia ejecta, while the halo gas at larger distance r ≫ d is pre-enriched from an earlier generation of young stars, then a radial dependence in relative [Fe/Mg] ratio should be observed. Subsequently, Zahedy et al. (2017) identified a dependence of median column density ratio, log ⟨N(Fe II)/N(Mg II)⟩med, on the galaxy’s projected distance, d, for a small sample of star-forming galaxies at z = 0.10−1.24 probed by background QSO sightlines at d = 8−163 kpc. These findings are consistent with the results in Figure 3b.
The observed trends mentioned above can be naturally explained by the evolving Fe/Mg abundance ratio, which arises from the changing relative rates of Type Ia and core-collapse supernovae (e.g., Nomoto et al. 1984; Woosley & Weaver 1995). Specifically, a Type Ia supernova is expected to produce approximately 0.7 M⊙ of Fe, while releasing no more than 0.02 M⊙ of Mg (e.g., Iwamoto et al. 1999). Different types of supernovae arise from progenitor stars with distinct stellar ages (e.g., Scannapieco & Bildsten 2005; Mannucci et al. 2006; Maoz et al. 2012), and the chemical evolution might offer clues about the proportions of both types of contributors. Consequently, the Fe/Mg abundance ratio at different impact parameters mainly reflects the in situ values. If we assume outflows with υ ≲ 1000 km s−1 originating in the star formation region about 1 kpc from the galaxy center (e.g., Harrison & Ramos Almeida 2024), it would take approximately 108 years to transport heavy elements from their original location across a distance of ∼100 kpc.
5. Summary
We have compiled a sample of 853 quasar-ELG pairs with an impact parameter of dp < 150 kpc from the SDSS DR16Q, where the median redshift for the foreground ELGs is 0.82 with a standard error of 0.12. In the spectra of the background quasars, we identified the Mg II absorption lines within a ±500 km s−1 velocity range around the foreground ELGs. This quasar-ELG pair sample has been divided into four bins based on impact parameter, with each group’s foreground galaxies having comparable median stellar mass, median SFR, and median redshift (as shown in Table 1). We generated median composite spectra in the four impact parameter bins. The equivalent widths of the Fe IIλ2600 and Mg IIλ2796 absorption lines were derived from these composite spectra. We observed that as dp increases, both  and
and  exhibit a significant decreasing trend.
Finally, we identified a significant dependence of the equivalent width ratio R ( ) on the projected distance, dp, which follows the relation
  log(dp [kpc]). These findings contribute to our understanding of the physical processes governing the CGM and the role of galaxy formation and evolution in shaping the surrounding gas. Certainly, this dependence could potentially be explained by the evolving Fe/Mg abundance ratio, driven by the changing relative rates of Type Ia and core-collapse supernovae.
The catalog of eBOSS_ELG_full_ALLdata_vDR16 from https://data.sdss.org/sas/dr16/eboss/lss/catalogs/DR16/
Acknowledgments
This work is supported by the National Natural Science Foundation of China (grant Nos. 2024YFA1611703 and 12133003), the Guangxi Natural Science Foundation (grant Nos. 2025GXNSFBA069287) and the Scientific Research Project of Guangxi University for Nationalities (2018KJQD01).
References
- Abazajian, K. N., Adelman-McCarthy, J. K., Agüeros, M. A., et al. 2009, ApJS, 182, 543 [Google Scholar]
- Ahn, C. P., Alexandroff, R., Allende Prieto, C., et al. 2012, ApJS, 203, 21 [Google Scholar]
- Begelman, M., de Kool, M., & Sikora, M. 1991, ApJ, 382, 416 [Google Scholar]
- Bergeron, J. 1986, A&A, 155, L8 [Google Scholar]
- Blanton, M. R., Bershady, M. A., Abolfathi, B., et al. 2017, AJ, 154, 28 [Google Scholar]
- Bordoloi, R., Lilly, S. J., Knobel, C., et al. 2011, ApJ, 743, 10 [CrossRef] [Google Scholar]
- Bordoloi, R., Lilly, S. J., Hardmeier, E., et al. 2014, ApJ, 794, 130 [NASA ADS] [CrossRef] [Google Scholar]
- Bowen, D. V., Hennawi, J. F., Ménard, B., et al. 2006, ApJ, 645, L105 [NASA ADS] [CrossRef] [Google Scholar]
- Ceverino, D., & Klypin, A. 2009, ApJ, 695, 292 [Google Scholar]
- Chen, H. W., & Zahedy, F. S. 2024, ArXiv e-prints [arXiv:2412.10579] [Google Scholar]
- Chen, H.-W., Helsby, J. E., Gauthier, J.-R., et al. 2010, ApJ, 714, 1521 [NASA ADS] [CrossRef] [Google Scholar]
- Chen, Z.-F., Qin, H.-C., Cai, J.-T., et al. 2023, ApJS, 265, 46 [NASA ADS] [CrossRef] [Google Scholar]
- Chen, Z., Wang, E., Zou, H., et al. 2025, ApJ, 981, 81 [Google Scholar]
- Chevalier, R. A., & Clegg, A. W. 1985, Nature, 317, 44 [Google Scholar]
- Chisholm, J., Tremonti Christy, A., Leitherer, C., & Chen, Y. 2016, MNRAS, 463, 541 [NASA ADS] [CrossRef] [Google Scholar]
- Churchill, C. W., Vogt, S. S., & Charlton, J. C. 2003, AJ, 125, 98 [Google Scholar]
- Churchill, C., Steidel, C., & Kacprzak, G. 2005, ASP Conf. Ser., 331, 387 [Google Scholar]
- Comparat, J., Delubac, T., Jouvel, S., et al. 2016, A&A, 592, A121 [NASA ADS] [CrossRef] [EDP Sciences] [Google Scholar]
- Dalla Vecchia, C., & Schaye, J. 2008, MNRAS, 387, 1431 [Google Scholar]
- Dawson, K. S., Schlegel, D. J., Ahn, C. P., et al. 2013, AJ, 145, 10 [Google Scholar]
- Dawson, K. S., Kneib, J.-P., Percival, W. J., et al. 2016, AJ, 151, 44 [Google Scholar]
- Dey, A., Torrey, P., Rubin, K. H. R., Zhu, G. B., & Suresh, J. 2015, MNRAS, 451, 1806 [NASA ADS] [CrossRef] [Google Scholar]
- Donahue, M., & Voit, G. M. 2022, Phys. Rep., 973, 1 [NASA ADS] [CrossRef] [Google Scholar]
- Farina, E. P., Falomo, R., Scarpa, R., et al. 2014, MNRAS, 441, 886 [Google Scholar]
- Faucher-Giguère, C.-A., & Oh, S. P. 2023, ARA&A, 61, 131 [CrossRef] [Google Scholar]
- Hafen, Z., Faucher-Giguère, C.-A., Anglés-Alcázar, D., et al. 2019, MNRAS, 488, 1248 [NASA ADS] [CrossRef] [Google Scholar]
- Harrison, C. M., & Ramos Almeida, C. 2024, Galaxies, 12, 17 [NASA ADS] [CrossRef] [Google Scholar]
- Hennawi, J. F., Prochaska, J. X., Burles, S., et al. 2006, ApJ, 651, 61 [NASA ADS] [CrossRef] [Google Scholar]
- Huang, Y.-H., Chen, H.-W., Johnson, S. D., & Weiner, B. J. 2016, MNRAS, 455, 1713 [Google Scholar]
- Huang, Y.-H., Chen, H.-W., Shectman, S. A., et al. 2021, MNRAS, 502, 4743 [NASA ADS] [CrossRef] [Google Scholar]
- Iwamoto, K., Brachwitz, F., Nomoto, K., et al. 1999, ApJS, 125, 439 [NASA ADS] [CrossRef] [Google Scholar]
- Jenkins, E. B. 2009, ApJ, 700, 1299 [Google Scholar]
- Johnson, S. D., Chen, H.-W., & Mulchaey, J. S. 2015, MNRAS, 452, 2553 [Google Scholar]
- Joshi, R., Srianand, R., Petitjean, P., & Noterdaeme, P. 2018, MNRAS, 476, 210 [NASA ADS] [CrossRef] [Google Scholar]
- Kelly, B. C. 2007, ApJ, 665, 1489 [Google Scholar]
- Kennicutt, R. C. 1998, ARA&A, 36, 189 [NASA ADS] [CrossRef] [Google Scholar]
- Kim, C.-G., & Ostriker, E. C. 2015, ApJ, 802, 99 [NASA ADS] [CrossRef] [Google Scholar]
- Kobayashi, C., Umeda, H., Nomoto, K., Tominaga, N., & Ohkubo, T. 2006, ApJ, 653, 1145 [NASA ADS] [CrossRef] [Google Scholar]
- Kobayashi, C., Karakas, A. I., & Lugaro, M. 2020, ApJ, 900, 179 [Google Scholar]
- Lan, T.-W., & Mo, H. 2018, ApJ, 866, 36 [NASA ADS] [CrossRef] [Google Scholar]
- Landoni, M., Falomo, R., Treves, A., Scarpa, R., & Farina, E. P. 2016, MNRAS, 457, 267 [Google Scholar]
- Lanzetta, K. M., Bowen, D. V., Tytler, D., & Webb, J. K. 1995, ApJ, 442, 538 [NASA ADS] [CrossRef] [Google Scholar]
- Lyke, B. W., Higley, A. N., McLane, J. N., et al. 2020, ApJS, 250, 8 [NASA ADS] [CrossRef] [Google Scholar]
- Mannucci, F., Della Valle, M., & Panagia, N. 2006, MNRAS, 370, 773 [Google Scholar]
- Maoz, D., Mannucci, F., & Brandt, T. D. 2012, MNRAS, 426, 3282 [NASA ADS] [CrossRef] [Google Scholar]
- Matteucci, F., & Greggio, L. 1986, A&A, 154, 279 [NASA ADS] [Google Scholar]
- Nelson, D., Pillepich, A., Springel, V., et al. 2019, MNRAS, 490, 3234 [Google Scholar]
- Nomoto, K., Thielemann, F. K., & Yokoi, K. 1984, ApJ, 286, 644 [Google Scholar]
- Nomoto, K., Iwamoto, K., Nakasato, N., et al. 1997, Nucl. Phys. A, 621, 467 [NASA ADS] [CrossRef] [Google Scholar]
- Oppenheimer, B. D., & Davé, R. 2006, MNRAS, 373, 1265 [NASA ADS] [CrossRef] [Google Scholar]
- Peeples, M. S., Werk, J. K., Tumlinson, J., et al. 2014, ApJ, 786, 54 [NASA ADS] [CrossRef] [Google Scholar]
- Prochaska, J. X., Hennawi, J. F., Lee, K.-G., et al. 2013, ApJ, 776, 136 [NASA ADS] [CrossRef] [Google Scholar]
- Prochaska, J. X., Lau, M. W., & Hennawi, J. F. 2014, ApJ, 796, 140 [NASA ADS] [CrossRef] [Google Scholar]
- Raichoor, A., Comparat, J., Delubac, T., et al. 2016, A&A, 585, A50 [NASA ADS] [CrossRef] [EDP Sciences] [Google Scholar]
- Raichoor, A., Comparat, J., Delubac, T., et al. 2017, MNRAS, 471, 3955 [Google Scholar]
- Rubin, K. H. R., Weiner, B. J., Koo, D. C., et al. 2010, ApJ, 719, 1503 [NASA ADS] [CrossRef] [Google Scholar]
- Scannapieco, E., & Bildsten, L. 2005, ApJ, 629, L85 [Google Scholar]
- Schiminovich, D., Catinella, B., Kauffmann, G., et al. 2010, MNRAS, 408, 919 [CrossRef] [Google Scholar]
- Shimizu, I., Todoroki, K., Yajima, H., & Nagamine, K. 2019, MNRAS, 484, 2632 [NASA ADS] [CrossRef] [Google Scholar]
- Smee, S. A., Gunn, J. E., Uomoto, A., et al. 2013, AJ, 146, 32 [Google Scholar]
- Thielemann, F. K., Argast, D., Brachwitz, F., et al. 2003, Nucl. Phys. A, 718, 139 [NASA ADS] [CrossRef] [Google Scholar]
- Timmes, F. X., Woosley, S. E., & Weaver, T. A. 1995, ApJS, 98, 617 [NASA ADS] [CrossRef] [Google Scholar]
- Tortora, C., Hunt, L. K., & Ginolfi, M. 2022, A&A, 657, A19 [NASA ADS] [CrossRef] [EDP Sciences] [Google Scholar]
- Tumlinson, J., Peeples, M. S., & Werk, J. K. 2017, ARA&A, 55, 389 [Google Scholar]
- Veilleux, S., Maiolino, R., Bolatto, A. D., & Aalto, S. 2020, A&ARv, 28, 2 [NASA ADS] [CrossRef] [Google Scholar]
- Villar Martín, M., López Cobá, C., Cazzoli, S., Pérez Montero, E., & Cabrera Lavers, A. 2024, A&A, 690, A397 [Google Scholar]
- Werk, J. K., Prochaska, J. X., Thom, C., et al. 2013, ApJS, 204, 17 [NASA ADS] [CrossRef] [Google Scholar]
- Werk, J. K., Prochaska, J. X., Tumlinson, J., et al. 2014, ApJ, 792, 8 [NASA ADS] [CrossRef] [Google Scholar]
- Whitaker, K. E., van Dokkum, P. G., Brammer, G., & Franx, M. 2012, ApJ, 754, L29 [Google Scholar]
- Woosley, S. E., & Weaver, T. A. 1995, ApJS, 101, 181 [Google Scholar]
- Wu, X., Cai, Z., Lan, T. W., et al. 2024, ArXiv e-prints [arXiv:2407.17809] [Google Scholar]
- York, D. G., Adelman, J., Anderson, J. E., et al. 2000, AJ, 120, 1579 [Google Scholar]
- Zahedy, F. S., Chen, H.-W., Rauch, M., Wilson, M. L., & Zabludoff, A. 2016, MNRAS, 458, 2423 [NASA ADS] [CrossRef] [Google Scholar]
- Zahedy, F. S., Chen, H.-W., Gauthier, J.-R., & Rauch, M. 2017, MNRAS, 466, 1071 [Google Scholar]
- Zhu, G., & Ménard, B. 2013a, ApJ, 773, 16 [Google Scholar]
- Zhu, G., & Ménard, B. 2013b, ApJ, 770, 130 [NASA ADS] [CrossRef] [Google Scholar]
- Zhu, G. B., Comparat, J., Kneib, J.-P., et al. 2015, ApJ, 815, 48 [NASA ADS] [CrossRef] [Google Scholar]
Appendix A: The median composite spectra of the ELGs in our sample
 |
Fig. A.1. Median composite spectra of the ELGs in our sample. Red lines from left to right indicate the sequential positions of the [O II] λ3729 line, Hβλ4862 line, and [O III] λ5007 line. |
All Tables
All Figures
|
Fig. 1. Redshift distribution of quasar-ELG pairs (top) and the stellar mass distribution of the ELGs (bottom) in our sample. The ELG redshifts exhibit a median value of 0.82 with a standard error of 0.12, while the media stellar mass of the ELGs is 10.29 M⊙ with a standard error of 0.27 M⊙. |
| In the text | |
|
Fig. 2. Demonstration of the median composite spectra of background quasars in different dp bins as shown in each of panel. The black and green lines represent the Mg IIλ2796 and Fe IIλ2600 absorption line profiles, respectively. The black and green dashed lines represent the standard deviation of the normalized flux density for Mg IIλ2796 and Fe IIλ2600, respectively. The gray shaded regions mark the spectral region used for measuring the equivalent widths of the Mg IIλ2796 or Fe IIλ2600 absorption lines. |
| In the text | |
|
Fig. 3. Rest-frame equivalent widths of Fe IIλ2600 and Mg IIλ2796 (panel a), as well as their equivalent width ratio (panel b), as functions of impact parameter dp for ELGs. In panel b, the red-solid line represents the best-fit relation: |
| In the text | |
|
Fig. 4. Probability density distribution of star formation rate (top panel) and stellar mass (bottom panel) for ELG samples in each bin. |
| In the text | |
|
Fig. A.1. Median composite spectra of the ELGs in our sample. Red lines from left to right indicate the sequential positions of the [O II] λ3729 line, Hβλ4862 line, and [O III] λ5007 line. |
| In the text | |
Current usage metrics show cumulative count of Article Views (full-text article views including HTML views, PDF and ePub downloads, according to the available data) and Abstracts Views on Vision4Press platform.
Data correspond to usage on the plateform after 2015. The current usage metrics is available 48-96 hours after online publication and is updated daily on week days.
Initial download of the metrics may take a while.